Robeco: Value investing – "The reports of my death have been greatly exaggerated"
As 2024 kicks off, we explore the resurgence of the Value factor since the Covid-19 vaccine announcement roughly three years ago, with insights from ten key graphs and analyses.
18.01.2024 | 08:13 Uhr
n November 2020, the announcement of a successful Pfizer-BioNTech Covid-19 vaccine candidate results triggered the long-awaited comeback of the value factor. Since then, value has been mainly on the rise. Here, in ten graphs, we review the developments since the announcement as well as some general insights on value investing.
1. Long-term performance of the 'enhanced' Value factor
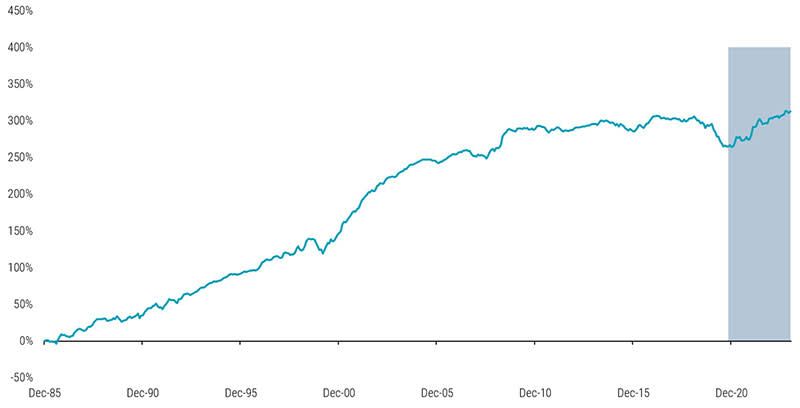
The first chart illustrates the cumulative performance of the enhanced value strategy for a global sample of large and mid-cap stocks since 1986. We use the 'enhanced value' definition throughout this post as given in our paper Resurrecting the Value premium. However, we focus on the pooled sample of developed and emerging markets for better readability.
Figure 1: Cumulative return for the enhanced Value factor

Source: Robeco, Refinitiv. The graph shows the cumulative return of an enhanced value strategy as in Blitz and Hanauer, 2021, 'Resurrecting the value 'premium', Journal of Portfolio Management. The enhanced value strategy is based on a composite of book-to-market (R&D adjusted), EBITDA/EV, CF/P, and NPY metrics. Stocks are sorted into quintile portfolios based on the value composite and the quintile portfolios are equal-weighted. We apply region and sector neutrality for developed markets by independently ranking stocks within each region/GICS level 1 industry (11 sectors) bucket. Developed market regions are North America, Europe, and Asia-Pacific. For emerging markets, we apply country neutrality. The investment universe consists of all nonfinancial constituents of the MSCI Developed and Emerging Markets indices. Before 2001, we used the FTSE World Developed Index for developed markets (going back to December 1985), and for emerging markets, the largest 800 constituents of the S&P Emerging BMI at the semi-annual index rebalance (going back to December 1995). The sample period is January 1986 to December 2023.
Despite its solid long-term track record, the strategy also suffered during the 'quant winter' from 2018 to 2020, after which many called value investing dead. However, the announcement of successful Pfizer-BioNTech Covid-19 vaccine candidate results on 9 November 2020 triggered a new spring for the value factor. This resulted in the long-awaited value comeback, which maintained traction in 2021 and 2022 and continued through 2023 (see comments regarding 2023 in our ninth graph). Overall, the enhanced value factor has delivered attractive long-term returns despite the challenging period between 2018 and 2020. Please note that the grey-shaded area presents the out-of-sample data after posting the abovementioned paper on SSRN.
Die Informationen auf der nachfolgenden Website der Robeco Deutschland, Zweigniederlassung der Robeco Institutional Asset Management B.V., richten sich ausschließlich an professionelle Kunden im Sinne von § 31a Abs. 2 Wertpapierhandelsgesetz (WpHG) wie beispielsweise Versicherungen, Banken und Sparkassen. Die auf dieser Website dargestellten Informationen sind NICHT für Privatanleger bestimmt und entsprechen nicht den für Privatanleger maßgeblichen gesetzlichen Bestimmungen.


Diesen Beitrag teilen: