


NN IP: Some general thoughts on recession triggers
Economist Willem Verhagen discusses recession triggers and what we can learn about the next US recession. Strategist Maarten-Jan Bakkum notes good capital flows in emerging markets and looks at politics in South Africa.
11.08.2017 | 08:47 Uhr
The US economy is probably close to full employment with an unemployment rate of 4.4%. No one knows the exact location of the equilibrium unemployment rate but it is clear that the labour market will overheat beyond some point if employment growth continues to run at its current pace close to 200K per month. Prolonged overheating has historically often been associated with an increased risk of recession, especially if the labour market overshoots by a wide margin. In this respect, it is useful to investigate a bit what the next US recession may look like and when it may occur.
Correctly forecasting a recession before it happens is extremely difficult. We usually do not know there is a recession until we are in the middle of it and the first sign is usually a clear rise in the unemployment rate, which reacts with a lag to the demand slowdown. If you believe, as we do, that economics is a bit like biology in the sense that it is a system (or even a system of systems) that evolves in unpredictable ways, then the inability to predict recessions seems pretty natural. Fortunately, this does not mean that there are no general principles governing the occurrence of recessions, albeit with differing relative weights over time. The most general model of a recession can be seen in the graph.
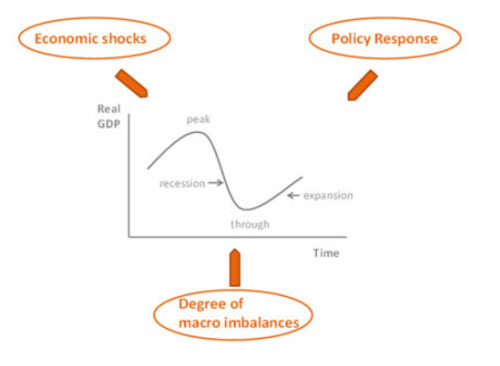
Recessions are essentially caused by economic shocks. Without shocks the spending plans of various actors (consumers, businesses, foreigners and the government) will tend to settle on a pretty steady path relative to their respective income streams. Of course all these spending plans must be made consistent with each other and the mechanism that achieves this is basically changes in relative prices in the broadest sense of the word (i.e. prices of goods but also risk free interest rates, risk premiums, exchange rates, return on physical capital, wage rates etc.). If all these prices are fully able to adjust, then the economy will automatically be guided to the point of full employment. This is the essence of the neo-classical view of the economy. The mainstream interpretation of Keynesian theory is that some of these prices cannot adjust or adjust very slowly, which means that the economy can get stuck in an equilibrium that features less than full resource utilization. The latter is still thought to be a point that is exogenously determined by demographics and technology. Some would argue that the obvious response would be to make all prices more flexible. First of all, this is not easy, as there are good institutional reasons why some prices are inflexible. For instance, nominal wage cuts may well demoralize the workforce such that productivity falls to such an extent that unit labour costs increase. Also it may give a devastating blow to consumer confidence if it happens on an economy-wide scale. Furthermore, if consumers are burdened with a high level of debt, then wage cuts will only increase this burden further, causing the economy to fall into a debt deflation death spiral, in which deflation causes an increase in debt burdens, which leads to asset fire sales and big falls in spending , etc.
Besides this, an even more important point getting more attention in academia ( and which was emphasized by Keynes himself) is that the economy could have a multitude of equilibria at which demand and supply match. In other words, demand could have a permanent effect on supply, for instance by influencing the incentive to invest in skills and knowledge or the number of discouraged workers. Which of these equilibria is then chosen depends on “animal spirits”. A collective bout of optimism can lead the economy to a good equilibrium, while widely shared pessimism begets a bad equilibrium. The important implication is that the price mechanism is not the only determinant of the economy’s long-run equilibrium. That collective psychology also plays a role.
Shocks are thus the primary cause of recessions because they perturb the spending plans of a number of actors in the economy. These shocks could come in all forms, sizes and shapes. For instance a sharp and sudden change in the exchange rate, a change in the oil price, a political event which triggers changes in confidence, natural of weather phenomena, sudden margin calls in the financial sector etc. The extent to which spending plans will change crucially depends on how resilient the underlying economy is. If agents face severe imbalances in the form of a high degree of leverage, currency and maturity mismatches, low profit margins, etc., then a small shock can trigger a big negative change in spending plans, which can cascade throughout the economy because it affects asset prices and the income of other agents. In all this, the policy response also matters. Policy can soften the blow by lowering interest rates/injecting liquidity or by fiscal expansion, thereby supporting overall demand and asset prices. However, it can also make things worse and act as a source of negative shocks. We saw this in 2010-13 in the case of concerted DM fiscal tightening and in 1929-33 in the US when the Fed allowed banks to fail on a large scale and liquidity to shrink big time.
Imbalances matter a lot
The key lesson from all this is that the cause and nature of the recession crucially depend on the nature of the underlying imbalances in the economy. Overheating alone is simply not enough to trigger a recession, but is often associated with the build-up of imbalances that eventually cause the economy to topple. Some pundits fear a repeat of 2008 based on the simple observation that nominal and real rates have been at historically low levels for a long time, which has gone hand-in-hand with a very decent performance of risky assets. Once again this is an observation that might make sense at first sight but does not hold up under close scrutiny. The key issue here is that policy has not been nearly as stimulative as these pundits make it out to be, something that is clearly indicated by the behaviour of nominal growth. From the late 1990s until 2008 nominal growth hovered in the 5-6% range but since 2012 it has been in the 3.5-4% range. This is one indication that the next recession may very well not look like the 2008 one but could be more of a typical post WWII variety. This still leaves a lot of options open when it comes to the trigger(s) of the next downturn.
To learn a bit more about this, it is instructive to review the causes of the mild early 1990s and early 2000s recessions. To start with the former, popular legend has it that the Savings & Loan crisis, combined with the 1990 oil price shock due to the Iraqi invasion of Kuwait, was the main trigger. There is certainly some truth to this story. However, it is important to remark that the S&L issue was a slow-burning one that began as early as 1986. S&L institutions issued loans for items such as autos or mortgages and obtained their funding by attracting retail deposits. A great many of them started to experience funding issues in the period of high and variable short-term rates because Regulation Q put a cap on the deposit rates they could offer. Meanwhile, money market funds were able to offer higher deposit rates as they were not subject to Regulation Q. In the end the funding cost for some S&Ls was systematically higher than the locked-in rate on the loans they had made. This induced them to engage in high-risk speculative activity. Adding insult to injury, a slow cooling of the US housing market in the second half of the 1980s increased the share of NPLs on S&L balance sheets. S&L failures peaked in 1989 and 1990, which led to a bit of credit crunch. This was not the direct cause of the recession but rather an imbalance that made the economy more susceptible to a negative shock. Between the spring of 1988 and the spring of 1990 the unemployment rate remained remarkably stable in the 5.5-5% range, which suggests there is nothing to stop the unemployment rate from stabilizing around current levels for the next two years or so. Nevertheless, core inflation rose from just below 3% in late 1987 to nearly 5% two years later, which caused the Fed to hike by 325 bps between the spring of 1988 and 1989. A year after the tightening cycle peaked the recession started. Just around that time the oil price also more than doubled in the space of a few months. Not surprisingly the whole cocktail led to a sharp fall in consumer and business confidence. The lesson of this recession is simple: it was caused by the combination of Fed tightening to combat excessively high inflation, a severely negative oil price shock and a sharp fall in confidence. These shocks reinforced each other and it was relatively easy for them to push the economy into recession because of the S&L credit crunch.
The recession of 2001-02 was of a different nature. In a sense it was a classic asset price and investment bubble. Optimism about ICT technology drove stock market valuations (both absolute and relative) to almost unprecedented levels. Corporate leverage also increased to record highs but the rise in the debt-to-equity ratio was probably dampened by the fact that a substantial part of the investment boom was financed by equity. The concomitant strong job market, as well as the sharp rise in net wealth, caused consumer sentiment to hover around record highs. It is important to remark that the policies of the Clinton administration managed to prevent strong domestic demand from morphing into a growing current account deficit as the public sector moved into surplus. Despite the fall in the unemployment rate, core inflation remained relatively subdued as it never rose materially above 2%. That having been said, headline inflation rose above 3% in the late 1990s due to the rise in the oil price. The Fed probably feared second-round effects in wage and price setting, which is why the policy rate was raised form 4.75% to 6.5% between the spring of 1999 and the spring of 2000. It is not easy to say whether the Fed hiking cycle was the main trigger of the bubble collapse or whether it simply collapsed under its own weight. Both explanations are probably true to some extent. What is clear, however, is that this recession was caused by a classic boom-bust cycle driven by animal spirits. It all started with some fundamental change in the real economy, in this case a productivity boom, which then causes over-optimism in the private sector, which expresses itself in excessively low risk premiums in financial markets and an investment boom in the real economy. For a while, these optimistic expectations seem to validate themselves as corporate balance sheets endogenously improve. However, at some point it becomes clear that valuations cannot be justified by the underlying stream of earnings, and the whole house of cards collapses. The recession that followed was relatively mild, probably because a lot of excess investment was equity financed. This enabled corporates to clean up their balance sheets without causing much contagion towards the rest of the economy. In particular, if a lot of the rise in investment had been debt financed, the consequences for credit supply could have been a lot more negative. In addition to this, the Fed had ample room to cut rates, which also facilitated the corporate deleveraging process and supported other demand components, most notably consumption spending by supporting the housing market.
Lessons for the next recession
So what can we learn from all this about the next recession? We note the following points:
- Private sector balance sheets look much healthier on the whole than back in 2008. Capital and liquidity ratios in the banking system have improved a lot. The household debt to GDP ratio is back to its 2002 level and is barely rising. Meanwhile, household net wealth (value of assets minus value of liabilities) is at an all-time high. Also from a flow perspective, things look pretty OK with a household savings rate and a non-financial private balance (income minus spending) close to 3% of GDP. This measure fell to around -4% during the stock market boom and -3% during the housing boom.
- Corporate balance sheets could be a bit of an exception here. Non-financial corporate debt peaked around 120% of GDP in early 2000, fell to 110-115% in 2004/05, then increased to 130% in 2008, fell again to around 125% in 2012 but now stand at 135-140%. The good news is that the increase levelled off sharply over the past 1.5 years (i.e. around the time when the tightening of corporate lending standards started). Still, this is clearly where the main vulnerability lies. It is difficult to assess how serious this imbalance really is. Net debt to equity for non-financials looks hovers around the 2008 peak and is well below late-1990s levels. This seems a bit strange but we have to bear in mind that net debt, which has been held down by the large pile of cash US corporates, have accumulated over the past years. If we add to this the high absolute level of profit margins (which is improving again over the past year) as well as the low level of interest rates (which are expected to rise only gradually) then corporate vulnerability seems limited. Still the devil may be in the details. The aggregates could hide substantial differences between high productivity/high profit margin firms at that technology frontier and laggards/low profit margin firms that fail to catch up. The latter could be more vulnerable and cause contagion effects in credit space and the real economy if they are hit by a negative shock.
- Given the persistent tendency for inflation to surprise on the downside the risk that the Fed will have to hit the brakes fast and furious seems very limited at this point in time. This holds all the more so because the fear of labour market overheating coupled with easy financial conditions keeps the Fed on a tightening path for now. Meanwhile, in financial markets some segments may look a bit frothy but given the afore-mentioned balance sheet fundamentals, a correction in these segments should have limited contagion effects.
- In the real economy both corporate investment and housing investment as a share of GDP are still below their long-run averages. Hence, the economy is certainly not suffering from overinvestment.
All this suggests that overheating the labour market is safer than it was on average historically. This is good news because the Fed may well have to do this if inflation expectations have fallen below target. Adding it all up this seems to leave the familiar culprit, animal spirits, as the most likely driver of the next recession in which case it could well interact negatively with corporate imbalances. In other words, the next recession is likely to involve a negative feedback loop between confidence, asset prices and spending appetite, which is more or less the reverse of what we see today. This makes us think the next recession is not around the corner. Still, in this space of feedback loops, things can turn pretty quickly especially if there is a negative shock in the form of some policy mistake. However, if and when the next recession happens it is more likely to be of the mild 1990/2001 variety rather than the wild 2008 one.
Emerging markets: good capital flows and South African politics
Capital flows to emerging markets continue to be strong. In July, thanks to abating worries about a faster-than-anticipated normalisation of DM monetary policy, broad capital flows clearly picked up from June. With most of the main emerging economies having published their FX reserves position for the month, we can estimate what the aggregate result for EM has been. We come to an inflow of USD 10 billion, compared with an outflow of USD 14 billion in June and an average inflow of USD 1 billion in the first half of the year.
Of course, this contrasts with what we saw in the years 2014-2016, when outflows repeatedly exceeded USD 100 billion on a monthly basis. This huge improvement is reflected in a sharp easing of financial conditions since the beginning of this year. Our own EM financial conditions indicator, which has been in positive territory since last February, has improved substantially in the past weeks. This means that the outlook for domestic demand growth in EM continues to brighten.
This week all eyes have been on South Africa, where the sixth vote of no-confidence in President Zuma was held in Parliament. A day before the vote, on Monday, the Parliament Speaker decided that the vote would be in secret. This increased the chance of Zuma being voted out. In a secret ballot, more ANC parliamentarians were expected to stand up against their president. On the news of the vote being held in secret, the rand appreciated by 1%. In the end, the motion of no-confidence did not get a majority. Most ANC members voted according to the party line, avoiding a disorderly leadership battle. The ANC leadership wants to postpone the decision of who will succeed Zuma until the December ANC elective conference.
Tuesday’s vote reflected, once again, that the party remains highly divided. After the vote, the rand gave away its gains of the day before. In the run-up to the December conference, the political and legal opposition against the president is likely to intensify. And more importantly, the fight between the main candidates to succeed him – Zuma’s ex-wife Dlamini-Zuma and deputy-president Ramaphosa – will come more to the forefront. At this stage, Ramaphosa is the favourite to become the new ANC leader. If elected, his main immediate challenge will be to prevent a split-up of the ANC. In the current environment, a victory of the ANC in the next general elections in 2019, is far from certain. Meanwhile, the uncertainty of South Africa’s economic policy direction remains high.
Diesen Beitrag teilen: