Janus Henderson: Chinese money trends
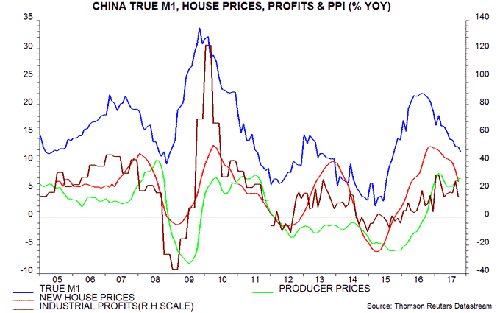
Annual growth of Chinese narrow money peaked at 22.1% in August 2016. In line with the normal historical pattern, the peak in narrow money growth was followed by peaks in annual house price inflation, industrial profits growth and producer price inflation. What the current signals indicate.
16.11.2017 | 09:27 Uhr
 Annual growth of Chinese narrow money – as measured by the true M1 aggregate* calculated here – peaked at 22.1% in August 2016. In line with the normal historical pattern, the peak in narrow money growth was followed by peaks in annual house price inflation (November 2016), industrial profits growth (January / February 2017) and producer price inflation (February 2017) – see first chart.

Annual narrow money growth fell further to 11.6% last month, the lowest since 2015. House price momentum, profits growth and producer price inflation should continue to soften into early 2018.
The issue for analysts is whether the money / credit slowdown signals a normalisation of economic growth and inflation after a period of buoyancy or rising risk of a “hard landing” scenario. Current narrow money trends still suggest the former.
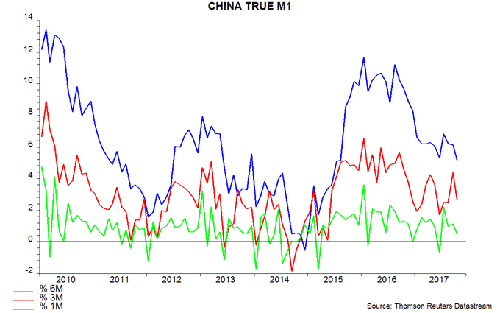
The fall in annual narrow money growth mainly reflects a step-down in the monthly trend in late 2016 / early 2017. The three-month rate of change has moved sideways since end-2016, suggesting that annual growth will level off soon – second chart.

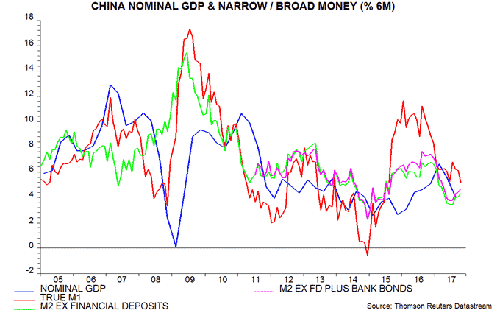
Annual and six-month narrow money growth remain at levels historically consistent with respectable nominal GDP expansion. Broad money trends are weaker but six-month growth of the preferred measure here, i.e. M2 excluding financial sector deposits but including bank bonds, has recovered since June and is well above the low reached in late 2014, when a “hard landing” was a serious risk – third chart.

After tightening policy during the first half of 2016, the authorities are maintaining a restrictive stance but may ease off in early 2018 as the housing market continues to soften and producer prices slow. Further monetary weakness would be concerning but the current signal remains moderately positive.
* True M1 = currency in circulation plus demand deposits of corporations, government organisations and households. The official M1 measure omits household deposits.


Diesen Beitrag teilen: