BNP Paribas: Be on the alert for a rebound in volatility
After the equity rally early this year, followed by a historic shock to implied volatility in US stocks, and then the emergence of a US-led trade war, what is the outlook for volatility?
19.07.2018 | 13:29 Uhr
Volatility is a risk indicator that measures the extent of price variations of a financial asset. Between two assets with an identical potential return, rational investors choose the one that is the least uncertain or the least volatile. In other words, they look at an asset’s ‘future journey’ and not just its destination.
Since the subprime crisis, central banks across the globe have pursued a process of quantitative easing by lowering their key rates and purchasing assets. More than USD 2.5 trillion was injected in 2017 alone. These asset purchases have followed a pre-determined schedule regardless of price, in contrast to what a traditional investor might do. These transactions had a psychological impact on investors by making them more confident.
QE and share buybacks: propping up confidence
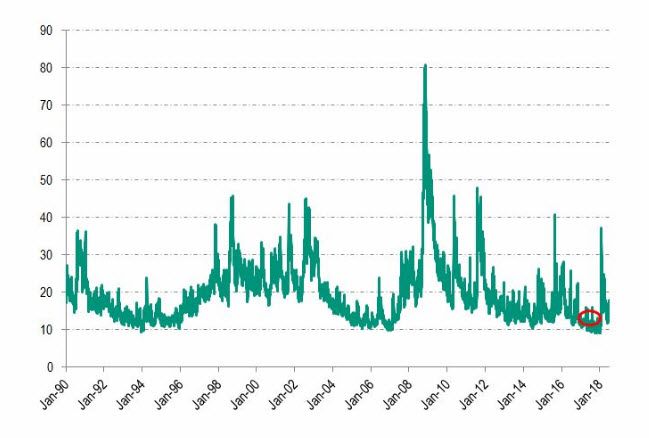
For a long time, this perception of price stability put volatility into a constant downward spiral, a trend that was maintained by widespread share buybacks in the US and by the development of certain strategies. Against this backdrop, realised volatility[1] on the S&P 500 hit an all-time low of 6.87 on 30 November 2017. Likewise, implied volatility as measured by the VIX[2] hit its lowest point since it was created in 1990, at 8.56 on 24 November 2017.
Exhibit 1: The CBOE Volatility Index (VIX) since 1990

Source: Bloomberg, as of 12/07/2018
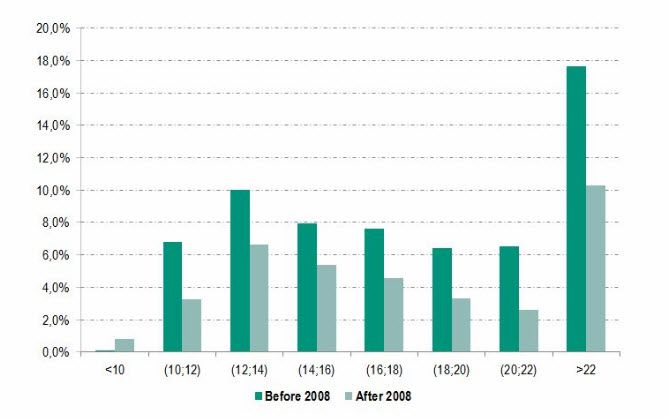
Exhibit 2: Percentage of trading days VIX spends between certain levels since 1990

Source: Bloomberg, as of 12/07/2018
Since it was created, the VIX has fallen below 9 in intraday trading on only seven occasions (seven different trading days), i.e. in 0.1% of cases out of more than 6 900 days. This exceptional situation reminded us of the 1986 book Stabilizing an Unstable Economy by the American economist Hyman Minsky, in which he argued that a perception of stability or comfort encourages investors to take on excessive risks.
And indeed, shortly thereafter, on 5 February 2018, the VIX spiked as it never had, in both percentage terms – 53.6% – and number of points (+20 points). The reasons for this were essentially technical. The search for yield led both institutional and retail investors to increasingly short volatility. The regular returns they achieved generated a downward bubble. Exposure expanded over time and ended up exacerbating the 5 February shock.
What is next?
Beyond this event, and with the hindsight perspective of a few months, some new trends are taking shape.
Alongside heightened political instability, central banks are now phasing out their accommodative monetary policies. The US Federal Reserve is continuing to raise its key rates and in October 2017 began to reduce its investments in Treasury bonds and mortgage-backed securities. The ECB, meanwhile, will stop buying bonds at the end of 2018 and will most likely raise its key rates in late summer 2019.
In the meantime, rising interest rates resulted in a slower pace of share buybacks in 2017, while US companies were excessively burdened with debt. Until 1980, share buybacks were actually illegal in the US due to the risk that company managers might use them to manipulate share prices, but since 2009, US companies have spent USD 5 trillion buying back shares.
The market impacts of share buybacks are often underestimated, as ‘blackout’ periods remind us. The five weeks before quarterly results are announced and the 48 hours thereafter after are ‘blacked out’, with the Securities and Exchange Commission banning company share buybacks. The major ‘drawdown’ losses of August 2015, January to February 2016, and February 2018 occurred precisely during blackouts or just after them.
What is more, during the equity market rally from February to March 2018, USD 200 billion in shares were bought back, more than in all of 2009. This history lesson shows how sensitive the market is to buybacks just as we are entering the ‘blackout’ period, which is expected to run from 25 June to 3 August 2018.
Share buybacks are actually expected to reach the exceptional level of USD 650 billion in 2018 (according to Goldman Sachs), driven by the US tax reform. Cisco has announced USD 25 billion in buybacks, Wells Fargo USD 22.6 billion, Pepsi USD 15 billion, Alphabet USD 8.6 billion, and Apple USD 30 billion. Even so, the slower pace of 2017 is likely to continue, as companies are highly debt burdened and would run the risk of a downgrade in their credit rating if they were to stick to the same pace of buybacks.
Equity volatility: rising to a higher averageTrading Days
Accordingly, the phase-out of asset purchases (by the central banks) and share buybacks (by companies) are likely to cause equity volatility to rise and stay at higher average levels in the future.
In conclusion, the age of ultra-low volatility is a thing of the past. The historic shock to volatility on 5 February 2018 was caused by excessive exposure, as well as the volume of share buybacks. Rising interest rates and the phase-out of asset purchases will likely lead to higher volatility in the coming months. It is hard to say precisely when this will happen but we are very likely to see spikes in volatility during the coming blackout periods.
[1] Historical volatility based on daily figures over the past rolling year
[2] The CBOE Volatility Index, known by its ticker symbol VIX, is a popular measure of the stock market’s expectation of volatility implied by S&P 500 index options, calculated and published by the Chicago Board Options Exchange


Diesen Beitrag teilen: