Janus Henderson: The case for US-small and mid-caps
The valuation of stocks are getting lofty. Time to consider defensive value strategies within small- and mid-caps.
29.05.2018 | 13:41 Uhr
The equity market’s rally of nearly nine years has taken valuations to very lofty levels and we have cautioned that investors should not ignore the mounting risks. We have been concerned for some time now that the extremely complacent marketplace – as measured by investor sentiment and the CBOE Volatility Index – was creating the potential for a violent correction in equity markets; concerns that were realised at the beginning of 2018.
Given the changing investment landscape and the numerous risks that accompany this shift, we believe that it makes sense now more than ever to consider defensive value strategies, especially within the small- and mid-cap space.
Setting the stage for value
‘Growth’ has outperformed ‘value’ since the market bottom in 2009, in a period marked by extremely low and falling interest rates and sub-par economic expansion. But the era of easy monetary policy appears to be coming to an end. The US Federal Reserve (Fed) raised its target benchmark rate by 25 basis points in March 2018, citing a continued improvement in the economic outlook and accelerating inflation pressures. This highly anticipated move put the range for the target benchmark rate between 1.50% and 1.75%, up from the extraordinarily low level of 0%-0.25% that we saw from late 2008 to 2015. This tighter monetary policy is expected to continue, with the Fed forecasting a steeper path of rate hikes in coming years.
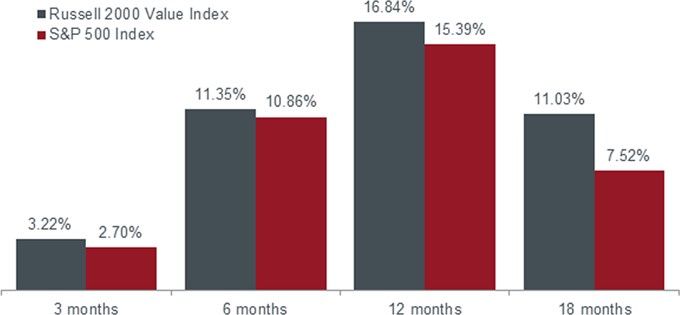
Value has historically outperformed during rising rate environments, as chart 1 shows. The Russell 2000 Value Index – a measure of US small-cap value equities – has outpaced the broader equity market, as represented by the S&P 500 Index, over a variety of time periods during which interest rate rises were initiated, from 1980 to 2004. Rising rate environments tend to favour value stocks because investors no longer have as much incentive to pay a premium for growth, as investors are able to earn greater returns from assets with lower price/earnings (P/E) ratio multiples, rather than from growth stocks alone.
Chart 1: Value typically outperforms following rate hikes

Source: Morningstar, data from 1980 to 2004. Average returns calculated for the stated time periods following rate hikes on: 7 August 1980, 1 February 1983, 1 October 1986, 4 February 1994, 30 June 1999 and 30 June 2004. Returns greater than one year are annualised. Past performance is not a guide to future performance.
Inflation
The return of inflation also bodes well for value stocks. Inflation is starting to revert to more normal levels, as shown by strengthening wage growth and price data, although it has remained stubbornly low throughout the post-2008 global financial crisis recovery. Its emergence has the potential to diminish the present value of earnings for growth stocks, which tend to have a longer time frame associated with their cash flows.
Additionally, many investments that are considered an ‘inflation hedge’ – in other words, a stock where the price is perceived as more likely to hold up better when inflation accelerates – are found in the value category. This includes commodity-linked companies whose hard assets have an intrinsic value that is less susceptible to inflationary pressures.
An ageing growth cycle
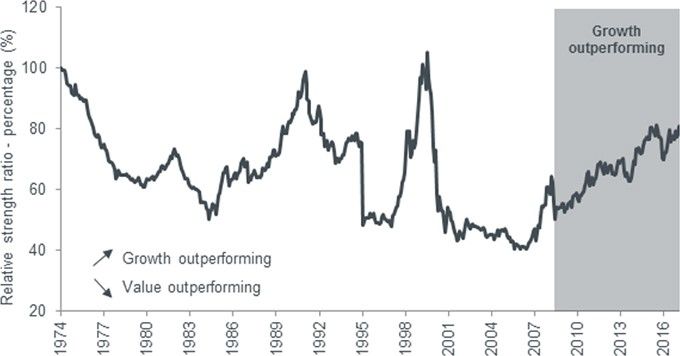
Mean reversion is another powerful trend that could favour value stocks. According to data from Morningstar Direct, the period from the fourth quarter of 1979 through to the first quarter of 2018, the average growth/value cycle lasted six quarters, while the longest growth cycle topped out at 12 quarters (1989–1992). Conversely, value generally outperformed growth in 2000–2007, a period that saw the Fed initiate rate hikes in 2002, with growth outperforming value in only three of the 27 quarters. However, growth has outperformed in 21 of the most recent 37 quarters.
Certainly, it is normal for the market to shift between cycles in which either value or growth outperforms, as chart 2 shows. But given how long the current growth-driven market has lasted, and the recent normalisation of market volatility, we believe that we may soon return to an environment in which value outperforms growth.
Chart 2: Growth has outperformed value since 2008

Source: Leuthold Group, data from December 1974 to February 2018. Data is drawn from Leuthold’s Royal Blue universe, which includes the 99 largest institutional equity holdings as determined by Leuthold research. The 33 highest P/Es companies are categorised as ‘growth’ and the 33 lowest P/Es are categorised as ‘value’. The relative strength ratio measures the cumulative monthly performance of growth vs value (total return including dividends, equally weighted). Rebased to 100 at inception (December 1974). Past performance is not a guide to future performance.
Finding opportunities in smaller market caps
Within the value arena, we believe in focusing on small- and mid-cap stocks. In our view, these companies are particularly well positioned to benefit from a number of macroeconomic trends, including tax reform, regulatory relief and rising rates attributable to an improving US economy. Smaller-cap firms tend to generate a majority of their revenues in the US and, therefore, pay a higher effective tax rate than their multinational peers. As a result, small and mid-sized companies stand to realise greater benefits from tax reform, as a significant reduction in their corporate tax rate will likely boost earnings.
The ability to expand, rather than reduce, capital spending may also provide a boost, as capital spending has been lacklustre for many years. Regulatory relief could also ease pressure for many industries, particularly financials. Proposed regulatory changes for banks would narrow the focus of oversight and exempt smaller institutions from some of the more onerous capital requirements.
A pick up in US gross domestic product growth should also disproportionately benefit smaller companies. Strengthening economic growth is likely to find its way into increased earnings estimates for smaller firms, since they tend to be more domestically oriented. A strengthening economic environment also supports the prospect of further rate hikes, which could further bolster financials. Higher interest rates aid banks, as they can then earn more from the spread between the interest rate they pay their customers and what they can earn on their lending activities.
Attractive relative valuations
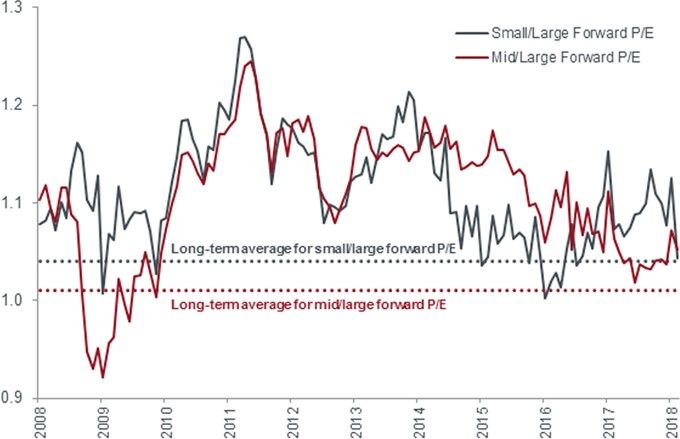
While valuations across the broad US equity market are currently elevated, we note that US small- and mid-cap stocks are not significantly expensive, relative to history, versus their large-cap counterparts. In February 2018, the relative forward P/E ratios for small- and large-cap equities versus their larger peers was 1.04, in line with a long-term average of 1.05. Similarly, the 12-month relative forward P/Es for mid-cap and large-cap equities was 1.05, compared with an average of 1.01. The ratio has been generally trending toward 1 in recent years, as chart 3 shows.
Chart 3: Small / mid-caps are not expensive relative to large caps

Source: Jefferies Group, as at 15 March 2018. The forward price-to-earnings (P/E) ratio measures share prices compared to forecasted earnings per share for the next 12 months for each stock in an index. The small/large forward P/E represents the ratio of the forward P/Es of the Russell 2000 Index and the Russell 1000 Index. The mid/large forward P/E represents the forward P/Es of the Russell Midcap Index and the Russell 1000 Index. When the ratio is one, the two indexes are equally valued. When the ratio is greater than one, the small- or mid-cap index is trading at a premium to the large-cap index. When the ratio is less than one, the small- or mid-cap index is trading at a discount to the large-cap index. The long-term averages of the small/large and mid/large forward P/E ratios represent the period from January 1987 to February 2018. Past performance is not a guide to future performance.
Focusing on quality
While we believe that value stocks, especially those on the smaller end of the market cap scale, are poised for strong performance, investors should not be complacent in their positioning. Certainly there are opportunities, but risks have increased in the market and smaller-cap stocks can be more susceptible to adverse developments than their larger peers.
Healthy balance sheets wanted
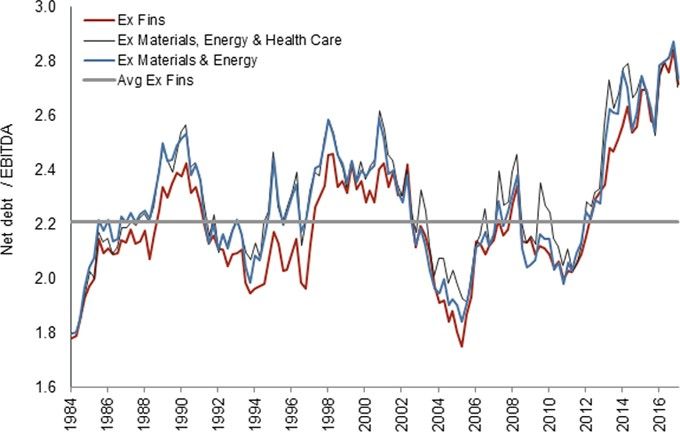
One such risk is leverage, which remains high across the market (see chart 4). In recent years, many companies have used easy monetary policy to irresponsibly increase leverage on their balance sheets. Companies have been able to easily access low-cost debt to engage in shareholder-friendly activities, such as stock buybacks and mergers and acquisitions. We are concerned that some of these companies may have taken on more debt than they can comfortably service. At this point in the business cycle – already extended by historical standards – it is especially troubling that many of these firms have not been diligent in subsequently deleveraging their balance sheets.
Chart 4: Leverage remains high for the Russell 2000 Index

Source: Jefferies Group LLC. Data as of 15 March 2018. Data shown represents net debt to earnings before interest, tax, depreciation and amortization (EBITDA) for the Russell 2000 Index between 31 December 1984 and 29 December 2017. Sectors are based on the Global Industry Classification Standard (GICS). ‘Ex Fins’ is an abbreviation of ‘Ex Financials’.
This creates a potentially dangerous dynamic. Until recently, the slow pace of economic recovery has been challenging for earnings growth, particularly in cases where a firm has significant cyclical or commodities exposure. An overly levered balance sheet may compound an earnings miss and make it much harder for a company to recover. Moreover, if profit margins decline from here, high debt levels could squeeze the levels of free cash flow. Given these trends and where we are in the business cycle, we believe it is especially important to look for companies with solid balance sheets.
Focus on the downside
Our primary focus has always been on potential downside risks. We are concerned by the continued bullish complacency we are witnessing in the market today. In our view, investors may be overlooking the downside risk that comes with lofty valuations, particularly when interest rates are rising. Therefore, we think it is increasingly important to focus on companies with durable competitive advantages (moats), reasonable stock valuations and healthy balance sheets.
Additionally, we believe that less mainstream holdings, which we think of as ‘off the beaten path’, may be less exposed to this general bullishness and, crucially, less exposed to a reversal in sentiment. Our research efforts increasingly direct us to stocks with minimal Wall Street or sell-side analyst coverage, management teams that are not overly promotional / are good stewards of shareholder capital, and niche businesses with secular business drivers. In navigating today’s great bull market, we believe that the further a stock is from front-page headlines, the better.
We also favour an eclectic mix of holdings. A healthy mix of different drivers of alpha (ie, risk-adjusted performance) has the potential to strengthen portfolios. We believe that having a diversified portfolio may help to navigate volatile markets, including changes in the geopolitical landscape and potential disruptions to free trade.
Looking beyond the headlines
Value stocks have been out of favour during the current bull market. But now, with interest rates starting to rise and inflation picking up, we believe value offers better risk-adjusted opportunities. Within value, we particularly like companies on the smaller end of the market cap spectrum. We believe they are reasonably valued on a relative basis and stand to benefit from macroeconomic tailwinds, such as a strengthening economy, deregulation and tax reform.


Diesen Beitrag teilen: