


NN Investment: Market Review - Emerging Markets

Emerging markets gross domestic product growth may gradually pick up in coming quarters.
07.06.2019 | 12:08 Uhr
Highlights
- EM torn between trade uncertainty and policy stimulus
- Divergence grows between trade- and capital-sensitive markets
EM domestic demand growth recovery
So far this year, EM growth has been weaker than we anticipated. The main problem has been the ongoing global trade uncertainty. The setback in the US-China trade negotiations from 5 May has made a quick recovery in Asian business confidence and a swift pickup in capital expenditure more unlikely.
At the same time, we are seeing a stronger commitment from the Chinese authorities to offset the negative growth impact from the trade conflict with economic stimulus measures. In addition, a more dovish stance from the Fed is sustaining capital flows to EM, which have been positive since November. This is helping EM central banks to further relax monetary policy. As a result, EM credit growth has started to pick up again in recent months, to a likely 10% in May.
Our view for EM growth is unchanged. We see limited room for a quick recovery in export growth and capital expenditure in manufacturing, particularly in Asia, but we see prospects for domestic demand growth improving, with supportive capital flows and further Chinese policy easing. On balance, EM GDP growth should gradually pick up in the coming quarters. For 2019, we have a GDP forecast of 4.5%, and for 2020 we have pencilled in 4.8%.
Insights from our protectionism indicator
We can cautiously deduce from recent market moves that many of the additional growth headwinds coming from the broken down US-Chinese trade negotiations have been priced. A key observation here is that EM equities have not underperformed anymore since mid-May, despite the new bad news for Asian manufacturing coming from the US ban on Huawei.
Before this relative calm, EM equities underperformed between February and May. The lack of clarity on the trade negotiations and the escalation in the first weeks of May made investors particularly risk-averse to EM assets. Additionally, EM currencies struggled between February and May, losing two-thirds of the appreciation they had gained since September. In line with EM equities, EM foreign exchange rates have also stabilised in the second half of May.
When we talk about EM equities and EM FX in the context of the US-China trade conflict, we assume that these categories are more sensitive to the risk of increased protectionism than developed-market assets. So the relative performance of EM assets tells us a lot about what kind of trade scenario investors are pricing. To be more precise about this, we have developed an indicator that should be more sensitive to trade than broad EM assets.
In the end, EM equities and EM foreign exchange rates also include countries or sectors that are not so trade-sensitive and are more driven by domestic factors (such as India) or by expectations about global interest rates and capital flows to EM. We believe that the improved prospects for global policy easing and the better environment for a steady search for yield explain why EM assets have stabilized in the past weeks and even outperformed more recently. This observation appears well supported by the good performance of the two markets that have the largest external financing needs and thus can be considered the most capital-hungry: Argentina and Turkey.
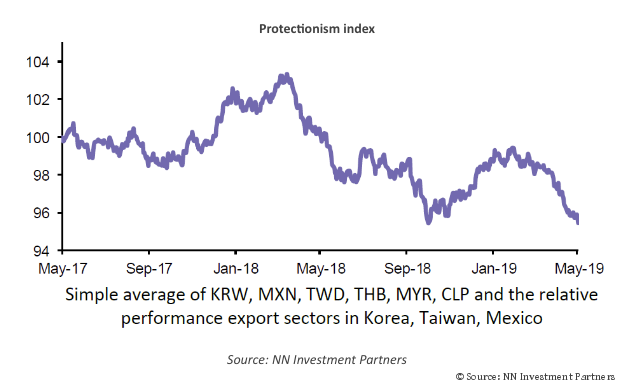
Let’s look a bit closer at our proprietary protectionism indicator. It comprises the most trade-sensitive EM currencies (Korean won, Taiwanese dollar, Thai baht, Malaysian ringgit and Chilean peso) and the relative performance of the export sectors vis-à-vis the broad equity market in the three main exporting economies (South Korea, Taiwan and Mexico). When the index declines, more protectionism is being priced. The first phase of the trade war, between Trump’s steel and aluminium tariffs and the G20 summit in Buenos Aires, coincides well with the downturn of our indicator. Since last April, the index has started to fall again, with a faster decline from the beginning of May, when Trump blew up the trade talks.
If we compare the most recent relative performance of EM versus DM equities with our protectionism indicator, we see a remarkable difference. While EM equities have started to outperform, the more trade-sensitive protectionism indicator continued to decline. In our view, the better performance of the former can be explained by the market perception of better prospects for EM capital flows. In line with the recent deterioration of the protectionism indicator, the most open manufacturing markets of Asia, South Korea and Taiwan have underperformed more.
In our base-case trade scenario of an extended escalation, there would be more downward pressure on the most trade-sensitive segments in global markets. Also, our protectionism indicator is likely to fall further, although at its current level it is already back to where it was before the December meeting between Trump and Xi in Buenos Aires. This means that all optimism regarding a deal since then has evaporated again. In EM, we expect continuous divergence between the markets that are most sensitive to US-China trade and the markets that benefit from easier monetary policy and improving EM capital flows.
If you would like to download the full Multi Asset Monthly, please click here.
Diesen Beitrag teilen: