Janus Henderson: High yield - navigating a slowdown
Credit managers Tom Ross, Thomas Hanson and Seth Meyer contrast the current backdrop for high yield with previous tightening cycles, indicating that dispersion can be the friend of the active investor.
24.01.2019 | 11:21 Uhr
Why has the US Federal Reserve (Fed) been hiking rates? It seems a peculiar question to ask when so much of the focus is on the future path of interest rates. It is a valid question, however, because in its answer lies the kernel of whether high yield bonds are attractive.
From a credit perspective, we should take some comfort from the fact that the Fed is hiking because US economic data is robust – wage growth is at 3.2% year-on-year (Dec 2018), unemployment is low and the manufacturing purchasing manager index at 54.1 (Dec 2018) remains well above the 50 expansion level. Tainting matters is the fact that global growth is slowing and how the Fed responds to this will be of vital importance to markets.
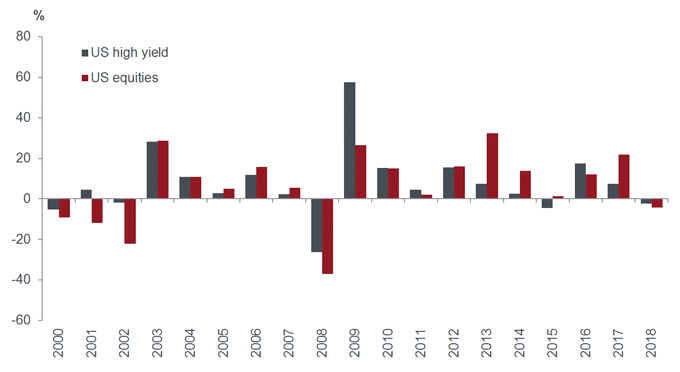
While the Fed has lowered its trajectory for rate hikes, what was clear from its December 2018 meeting was a determination not to let equity market prices dictate its actions, with rate rises still pencilled in for 2019, although the Fed Chairman Jerome Powell struck a more conciliatory tone at the start of 2019. With this in mind, should high yield investors be worried about the sharp fall in equity markets in late 2018? On the one hand, markets had become frothy so it was a healthy correction. On the other, high yield and equity tends to have a closer correlation than other areas of fixed income, both being sensitive to corporate conditions. It is difficult to see high yield rallying against a declining equity market, although declines in high yield are typically well below those of equities. In 2008, for example, US high yield fell 26% against a fall of 37% in the S&P500, high yield also recovered more impressively the following year. Moving further back in time to the dot-com bust, the S&P500 fell for three years (2000-2002 inclusive): equity returns were consecutively -9%, -12%, and -22% against US high yield returns of -5%, +5% and -2%.
Figure 1: US high yield bond and equity annual total return

Source: Thomson Reuters Datastream, 31 December 1999 to 31 December 2018, ICE BofAML US High Yield Total Return Index, S&P500 Total Return Index, USD.
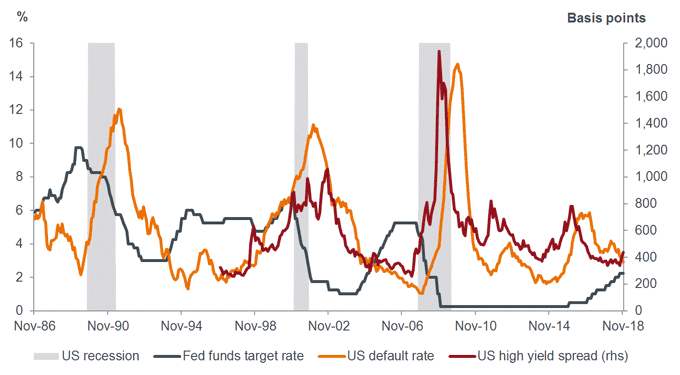
Past performance is not a guide to future performanceThe danger agitating investors is whether the Fed will overshoot and cause a recession. As Figure 2 shows, previous tightening cycles have typically presaged an economic downturn, although 1994/95 showed this need not be the case, while the lead time from the start of tightening to a recession can stretch into years.
Figure 2: Fed tightening need not always lead to a recession

Source: 30 November 1986 to 30 November 2018, FRED US recession dates, Federal Reserve federal funds target rate, Moody’s US trailing 12m speculative grade default rate, ICE BofAML US High Yield (H0A0) spread-to-worst versus government.
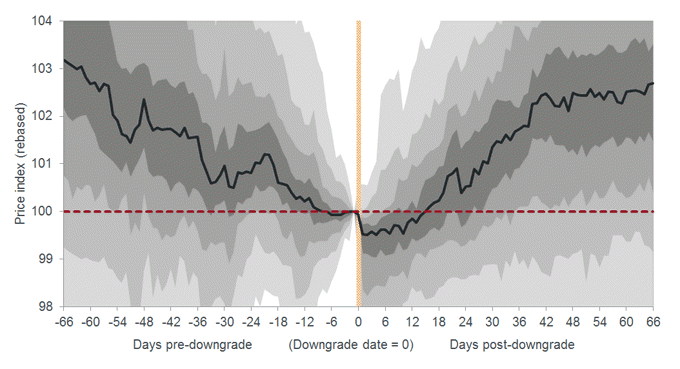
Currently, earnings and economic expansion are still strong but we are under no illusions – they can often look like this a year or two ahead of a downturn. Consumers and banks were over-borrowed in the last economic cycle. This time round they are better behaved, with the US household debt to income ratio substantially below its 2007 level and back to 2001 levels. Banks’ capital ratios are also far stronger than before the financial crisis.Corporate leverage and government borrowing, however, have both risen. Of more concern is corporate borrowing. Non-financial corporate debt is at peak levels, although this is driven by investment grade borrowers. Interestingly, US high yield companies in aggregate have been de-leveraging in the last two years and net supply of high yield bonds has shrunk for the third year in a row. This positive fundamental and technical backdrop is mirrored across the Atlantic where the European high yield bond market has seen net debt ratios fall since 2013 and there has been no growth in size of the high yield market in the last few years as companies have – in common with the US – shown a preference for leveraged loans and direct borrowing. In fact, the Fed’s determination to raise interest rates and shrink its balance sheet may be a signal that it is more worried about a deterioration in underwriting standards in these areas of non-bond lending, which its easy policy conditions had helped propagate.Re-leveraging among corporate borrowers, however, can take two forms: active, where the proceeds of additional borrowing are used for bond-holder unfriendly activities such as debt-fuelled mergers and acquisitions or share buy-backs; or passive, where declining earnings erode the denominator in the net debt/EBITDA1 ratio.The swelling of the BBB market in the US and Europe means there is concern that higher-leveraged investment grade issuers may be downgraded to high yield if earnings and cash flows come under pressure. This could cause yields to climb as the relatively smaller high yield market seeks to absorb a wave of new arrivals. This is a threat we are cognisant of, although it is not wholly unwelcome since downgrades often bring a different type of issuer.The rise of passive funds within fixed income also means any shakeout should be more advantageous for active managers, since they will be in the strongest position to discriminate among holdings. Typically, when a bond is downgraded from investment grade to high yield, there is a window of opportunity to buy at a price that is technically depressed by forced selling and often recovers subsequently (see Figure 3).
Figure 3: Price performance of bonds following a downgrade (2003-2016)

Source: Morgan Stanley Research, Bloomberg, Markit, February 2016. Note: Each colour band represents one decile; dark line represents sample median. Based on a universe of 89 fallen angel issuers representing 212 euro-denominated bonds between 2003 and 2016.
Past performance is not a guide to future performance.We can also expect – and are seeing – greater single name and sector dispersion particularly in European high yield as markets reflect the late-cycle environment and fundamentals begin to take on greater importance. Again, this is an environment that can offer opportunities for active investors.So 2019 looks to be a challenging market but with spreads having widened considerably in the second half of 2018, the high yield market is already pricing in a more difficult period. Within European high yield, for example, the average spread on B rated bonds was 724 basis points at 31 December 2018, more than 200 basis points above their levels in December 2007 and 70 basis points above the 20 year average2. From a value basis, we would argue that European high yield looks more attractive than US high yield and Europe remains earlier in the cycle than the US. The rest of the world has struggled to decouple from the US, so what happens in the world’s biggest economy is likely to create ripples more broadly. For that reason, we will be keeping a keen eye on the Fed.
1 EBITDA= earnings before interest, tax, depreciation and amortisation.
2 Source: ICE BofAML Bloomberg European Currency High Yield B Index (HP20), govt option-adjusted spread.


Diesen Beitrag teilen: