


Janus Henderson: UK monetary trends - weakness extends
Before Bank of England Governor Mark Carney’s latest handbrake turn, the expectation here was that the MPC would raise interest rates again in May, based on prior “guidance” and strong labour market data. Such a move, however, was viewed as dangerous against a backdrop of weakening monetary trends.
07.05.2018 | 10:01 Uhr
 The change of signal from Governor Carney, of course, had nothing to do with monetary concerns. It seems, instead, to have been part of a loosely coordinated shift in favour of slower policy “normalisation” by major central banks, excluding the Fed, probably motivated by a combination of US dollar weakness and softer economic data. The Bank of Canada also pushed back against early rate hike expectations, while last week’s ECB and BoJ communications were dovish.
The MPC shift has slightly reduced downside economic risks but March monetary data released today continue to suggest deteriorating prospects.
The forecasting approach here emphasises the narrow non-financial M1 measure, comprising cash and sterling sight deposits of households and private non-financial corporations (PNFCs). Annual growth of this measure fell further to 4.4% in March, the lowest since 2012, while the rate of increase in the latest three months was just 1.6% – see first chart.
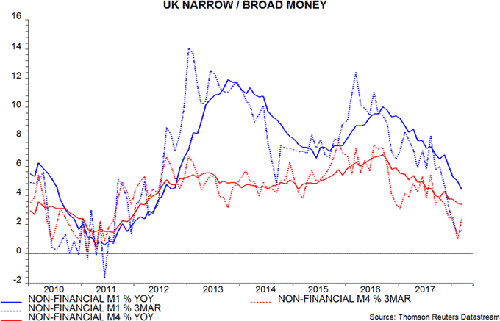
Broad money trends are also weak. Annual growth of non-financial M4 – which includes household / PNFC holdings of sterling time deposits, cash ISAs, short-term bank securities and repos – declined to 3.4% in March, with a 2.4% rate of increase in the latest three months. The comparable figures for the Bank of England’s M4ex broad measure were 3.8% and 1.2% respectively. M4ex includes financial-sector money holdings but these are volatile and contain little information about near-term economic prospects.
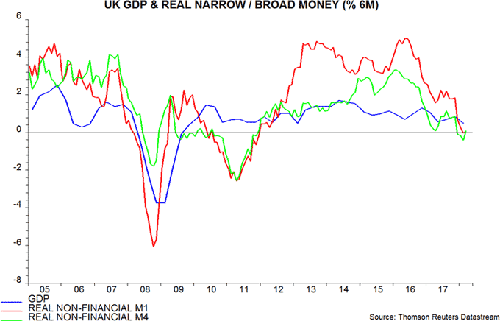
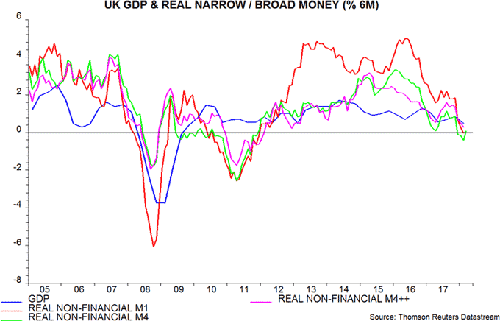
The second chart shows the two-quarter change in GDP and six-month changes in real non-financial M1 and non-financial M4, i.e. deflated by consumer prices (seasonally adjusted). The recent decline in inflation has supported real money trends but the six-month changes remain close to zero, suggesting very weak economic prospects.
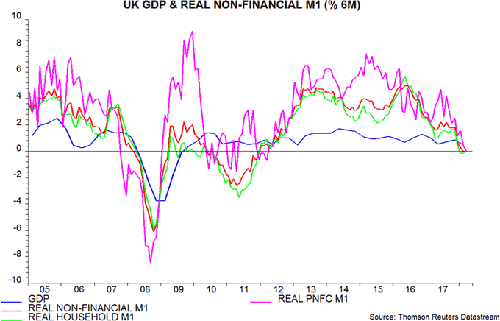
The slowdown in real non-financial M1 was initially driven mainly by the household component but the six-month change in corporate (PNFC) real M1 fell to zero in March – third chart. This is significant because the corporate component individually has been a reliable leading indicator of GDP trends – it turned down well in advance of the 2008-09 recession – and current weakness may indicate that business are cutting back investment and expansion plans.
In a recent speech, the MPC’s Michael Saunders downplayed concern about weaker broad money growth, arguing that households’ demand for money has been depressed by a portfolio shift into mutual funds. Without presenting data, Mr Saunders suggested that, adjusting for this shift, broad money growth was similar to the last few years.
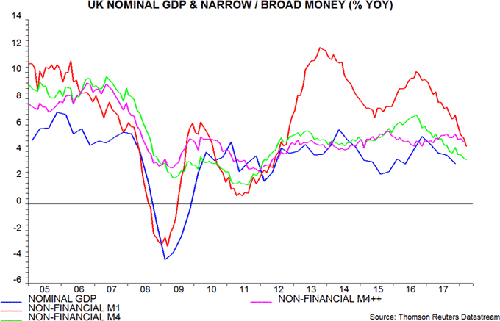
The fourth chart compares annual growth of non-financial M1, non-financial M4 and a broader measure incorporating national savings, foreign currency deposits and retail flows into UK-registered unit trusts and OEICs (“non-financial M4++”). Growth of this latter measure is, indeed, around its average in recent years.
Mr Saunders’ view that this resilience offers reassurance about economic prospects is not shared here, however, for several reasons.
Mutual fund holdings are not money. A portfolio shift out of money into funds indicates a reduced likelihood of near-term spending. Focusing on an all-encompassing aggregate, therefore, risks throwing away important information about economic prospects.
Consistent with this, the broader measure has underperformed non-financial M1 and non-financial M4 as a forecasting indicator in recent years. Annual growth of nominal GDP rose over 2012-14, fell in 2014-15, moved up again in 2015-16 before declining recently. Each of these swings was clearly signalled in advance by the conventional money measures. Growth of the broader aggregate, by contrast, showed little variation. In particular, it failed to predict the recent significant nominal GDP slowdown.
While annual growth of the broader aggregate remains respectable, its six-month change is now weakening. Together with the rise in consumer price inflation since early 2016, this has resulted in a meaningful fall in six-month real growth – fifth chart*. The broader financial aggregate, that is, is belatedly confirming the slowdown signal from conventional money measures.
*Latest = February; mutual fund flow data for March have yet to be released.
Diesen Beitrag teilen: