Janus Henderson: Reverse combination
Global growth strengthened in late 2016/early 2017 and investors are upbeat about prospects. Monetary trends and leading indicators, however, suggest that momentum will cool over the summer, posing a risk to high-flying markets – particularly if the Federal Reserve continues to tighten policy.
07.08.2017 | 09:30 Uhr
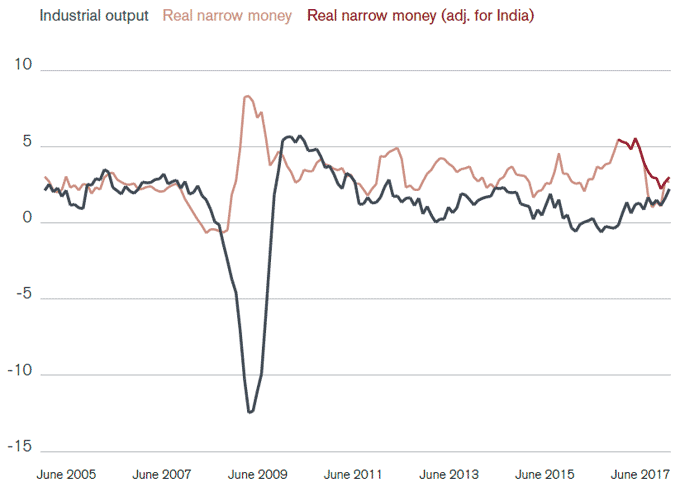
Six-month growth of global* industrial output reached a three-year high in April 2017 – see figure 1. Strength had been predicted by a rise in six-month growth of real (i.e. inflation-adjusted) narrow money** to a peak in August 2016. Turning points in real money growth have led those in output growth by nine months on average historically.
Real money growth, however, fell sharply between August 2016 and February 2017. Weakness was exaggerated by India’s demonetisation programme but a significant slowdown occurred elsewhere. Allowing for the usual lead, this suggested that output growth would slow from spring 2017.
Figure 1: G7 + E7 industrial output and real money growth (% 6m)

Source: Thomson Reuters Datastream, June 2005 to June 2017.
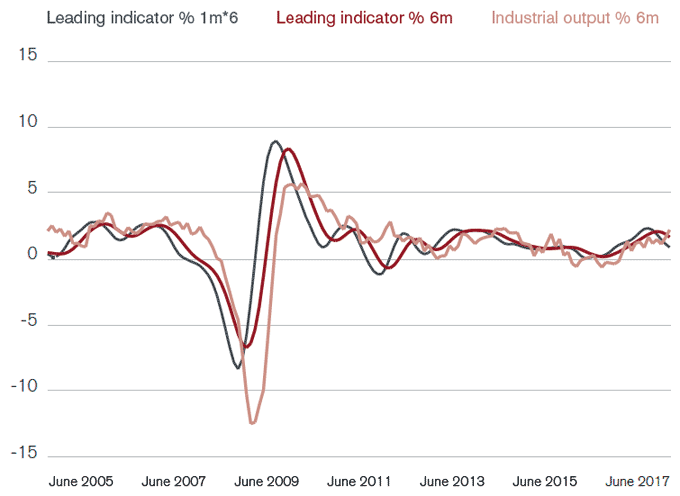
The monetary signal of a near-term loss of momentum is supported by a global leading indicator based on the OECD’s country leading indicators, which combine a range of forward-looking economic series. The average lead time of this indicator is about four months; its six-month increase peaked in January – see figure 2.
Figure 2: G7 + E7 industrial output and leading indicator (%)

Source: Thomson Reuters Datastream. Note: %6m = % change in indicator from six months earlier. %1m*6 = % change from previous month multiplied by six (the multiplication aids comparison with the %6m change)
Economic slowdowns are not necessarily negative for equity markets and can even be positive if they elicit monetary policy easing. Central bankers, however, are unlikely to be sensitive to a modest softening of economic data given the current tightness of labour markets – the G7 unemployment rate of 5.0% in April was the lowest since 1980.
The Fed, indeed, could raise rates by more than markets expect over the remainder of 2017. US trends appear to be leading the rest of the world. US six-month real narrow money growth started falling in May 2016, four months ahead of the global measure, and GDP expansion was weak in the fourth and first quarters. Real money growth, however, has rebounded since early 2017, suggesting that the economy will regain momentum during the second half, in turn raising the prospect of a more hawkish Fed.
Equity markets have partied over the last year in response to strengthening global economic growth and slower-than-expected Fed tightening. Investors may need to prepare for the reverse combination.
Key points
- Monetary trends and leading indicators pose a risk to high-flying markets
- Six-month growth of global industrial output reached a three-year high in April 2017
- Real money growth fell sharply between August 2016 and February 2017 so output growth may slow down
- Economic slowdowns are not necessarily negative for equity markets
- If economic growth picks up in the second half, the Fed could turn more hawkish
*“Global” = G7 developed economies plus seven large emerging economies (“E7”).
**Narrow money = currency in circulation plus demand/overnight deposits.


Diesen Beitrag teilen: