


Janus Henderson: Euroland money trends suggesting stable outlook
Six-month growth rates of Euroland real (i.e. inflation-adjusted) narrow and broad money declined in April / May but are in the middle of their ranges over the past three years, suggesting future GDP expansion of around the average over this period, i.e. a little under 2% annualised. This would be below expectations based on recent strong business surveys but in line with the ECB’s forecast, supporting plans to wind down policy stimulus later in 2017.
30.06.2017 | 10:55 Uhr
Six-month growth of real narrow money, as measured by non-financial M1 deflated by consumer prices, was 4.0% (not annualised) in May, down from a recent peak of 4.5% in March and slightly below a three-year average of 4.3% (i.e. from May 2014 to April 2017). Growth of real non-financial M3 was 1.8% versus 2.3% in March and a three-year average of 2.1% – see first chart.
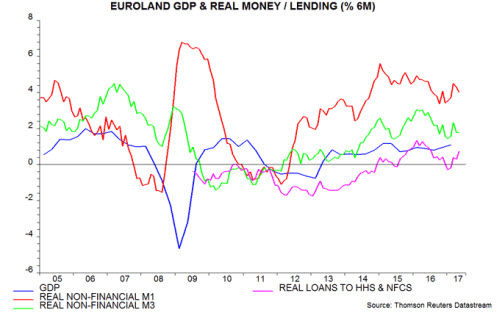
Both measures are lower than a year ago, suggesting that GDP momentum is at or close to a peak. GDP rose by 1.1%, or 2.2% annualised, in the fourth and first quarters combined. With the real money growth measures close to their three-year averages, GDP expansion may fall back to around its three-year mean of 1.8% annualised.
The compiler of the purchasing managers’ surveys claims that the average level of the composite output index in the second quarter is consistent with quarterly GDP growth of 0.7%, or 2.8% annualised. The suspicion here is that surveys are overestimating current strength and will realign with the monetary signal – the PMI output index, indeed, declined in June.
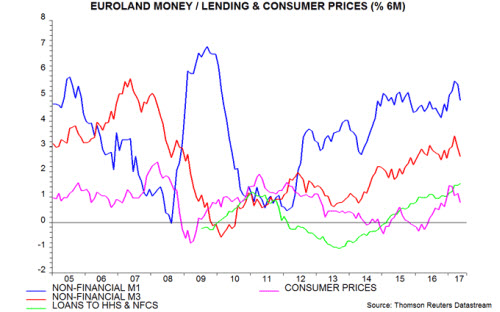
The fall in the real money growth measures in April / May reflected a larger decline in nominal expansion partially offset by a slowdown in consumer prices following a surge in late 2016 / early 2017 – second chart.
The non-financial money measures cover holdings of households and non-financial corporations. The official M1 and M3 aggregates also include deposits held by non-bank financial corporations – such deposits are volatile with fluctuations largely unrelated to economic prospects. Growth of real M1 and M3 was lower than that of real non-financial M1 and M3 during 2016, i.e. the official measures underpredicted economic strength . The measures have converged recently.
Some monetary economists claim that ECB QE drove money growth higher, laying the foundation for recent solid economic performance. As the charts show, narrow and broad money accelerated strongly in mid-2014, well ahead of the start of QE in March 2015. The view here is that interest rate cuts and ECB lending programmes were more powerful drivers than QE.
Mirroring the experience elsewhere, the direct boost to broad money from QE has been largely offset by a deterioration in the balance of payments basic balance (i.e. much of the liquidity created has been exported) and by commercial banks shifting from buying government bonds to selling them (because the increase in their reserve holdings at the ECB due to QE has reduced their demand for safe liquid securities). The 12-month sum of the contributions of the ECB’s “public sector purchase programme” (PSPP), external banking flows and commercial bank transactions in government securities to the change in broad money M3 has risen by only €80 billion since end-2014, equivalent to a 0.7 percentage point addition to annual M3 growth (i.e. small) – see third chart.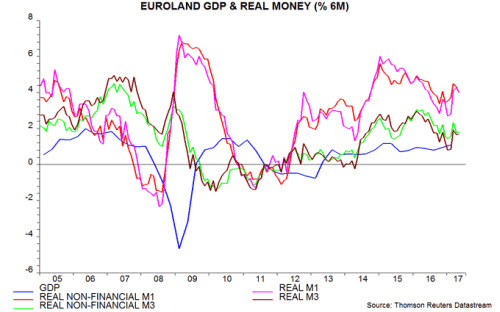
QE wind-down, by extension, may exert only a limited drag on monetary trends.
Diesen Beitrag teilen: