


Henderson: UK inflation: strong core pick-up, food next?
UK annual consumer price inflation rose from 2.3% in March to 2.7% in April and remains on course to move above 3% later in 2017, exceeding the MPC’s upwardly-revised central forecast (showing inflation peaking at 2.8% in the fourth quarter).
23.05.2017 | 14:30 Uhr
The 2.7% April reading was above a consensus forecast of 2.6% but in line with the Bank of England staff’s projection in last week’s Inflation Report.
March inflation had been suppressed by a year-on-year fall in air fares due to the later timing of the Easter holiday in 2017 compared with 2016. This effect reversed in April. Excluding air fares, CPI inflation was 2.4% in March and 2.5% in April (2.54% before rounding).
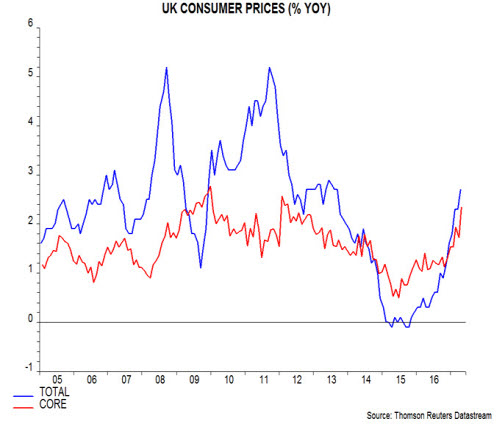
The April increase was driven by “core” inflation rather than energy / food prices. The preferred core measure here is the CPI excluding energy, food, alcohol, tobacco and education adjusted for the estimated impact of VAT changes. This rose to 2.3% in April, the highest since 2012 – see first chart.
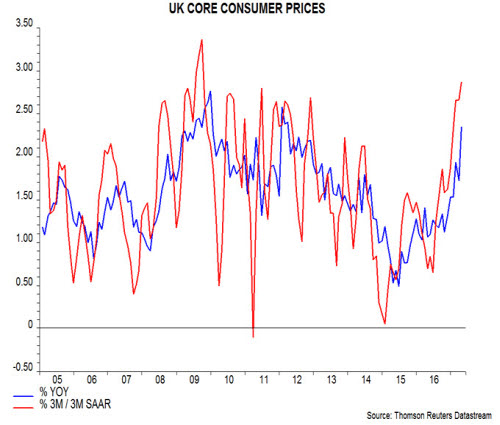
Core prices increased at a seasonally adjusted annualised rate of 2.9% in the three months to April from the previous three months – second chart. (Note that the seasonal adjustment programme used accounts for Easter timing effects.)
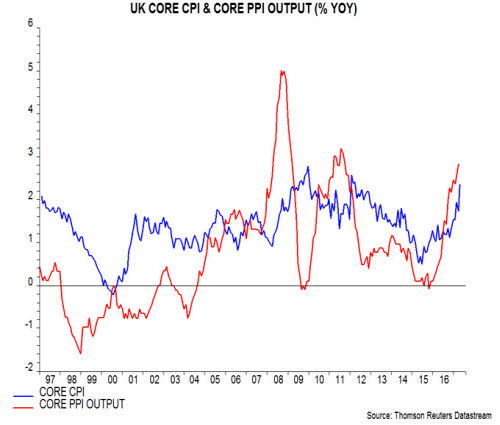
Annual core producer output price inflation – i.e. excluding food, beverages, tobacco and petroleum – also continued to pick up in April, reaching 2.8%, the highest since 2011. Core PPI inflation has tended to lead core CPI inflation directionally, suggesting a further increase in the latter – third chart.
The long-standing forecast here that CPI inflation would move above 3% during 2017 was based on core inflation rising to about 2.5% and upward pressure on energy / food prices lifting the headline / core gap to more than 1 percentage point (pp). Core inflation is on track but the headline / core gap pulled back from 0.6 pp in March to 0.4 pp in April.
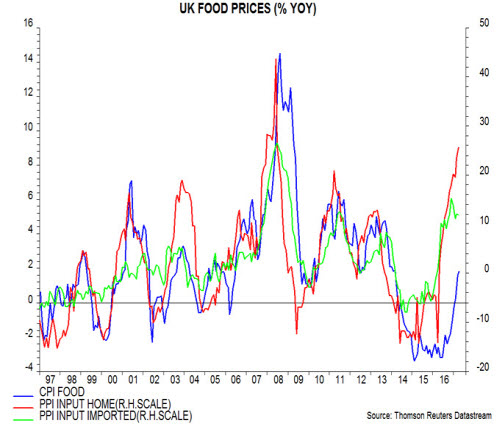
Stronger food price inflation should contribute significantly to a widening of the gap over coming months. Annual food inflation remained modest at 1.8% in April but large increases in home-produced and imported food material costs suggest a pick-up to perhaps 5-6% later in 2017 – fourth chart.
As previously argued, inflation is rising in lagged response to a significant increase in monetary expansion between 2011 and late 2016. The fall in the exchange rate has been part of the “transmission mechanism” from loose money to faster price rises, rather than being a primary driver. The historical evidence is that money growth peaks lead core inflation peaks by between two and three years. Assuming that annual broad money growth topped out last autumn*, the suggestion is that inflation will remain under upward pressure through late 2018, at least.
*Annual growth of non-financial M4 peaked at 6.8% in September 2016 and was 5.2% in March 2017.
Diesen Beitrag teilen: