


Janus Henderson: Will global money trends stabilise soon?
The global real money measure tracked here appears to have slowed further in January, reinforcing the expectation of a significant loss of economic momentum later in 2018.
22.02.2018 | 09:37 Uhr
 The US, China, Japan, Brazil and India have released January monetary data, together accounting for two-thirds of the G7 plus E7 aggregate tracked here. Assuming unchanged money growth in other countries, and incorporating near-complete inflation data, six-month expansion of G7 plus E7 real narrow money is estimated to have reached another nine-year low – see first chart.
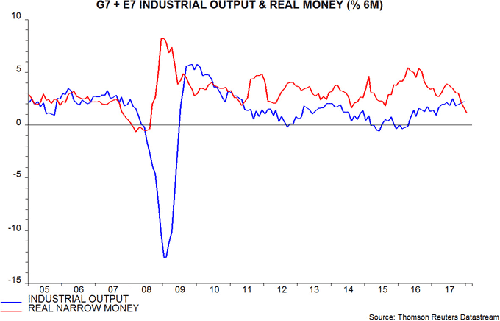
With six-month industrial output growth expected to have been little changed from December, real narrow money expansion is likely to have fallen short of output growth for a second month, suggesting unfavourable prospects for equity markets – see previous post.
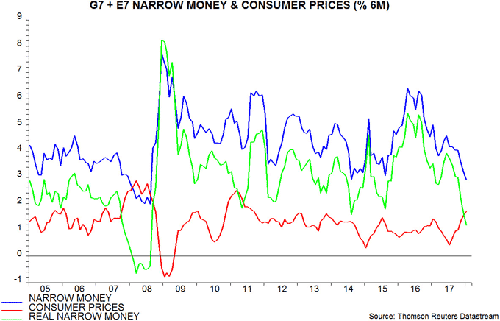
The fall in real narrow money growth since mid-2017 reflects both lower nominal expansion and a pick-up in six-month consumer price inflation – second chart.
Money trends suggest significant downside risk to consensus economic growth expectations but are still far from signalling a recession – every global downturn since the 1960s (at least) was preceded by a contraction of real narrow money. The expectation here is that six-month real money growth will stabilise or recover slightly over coming months, for two reasons.
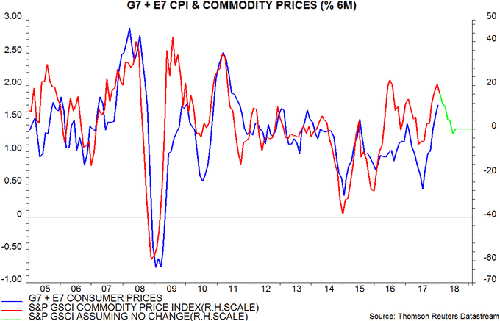
First, six-month consumer price inflation may have reached a near-term peak in January, assuming that commodity prices stabilise at their current level – third chart.
Secondly, US narrow money growth may revive into mid-2018 as tax cuts lift disposable incomes and spending intentions. Stronger US monetary data may offset weaker trends elsewhere.
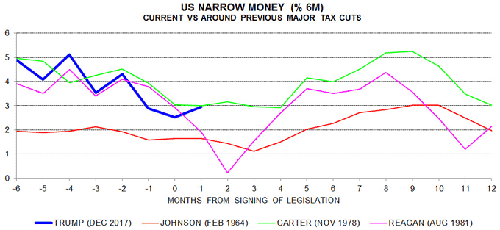
We examined the behaviour of US narrow money growth around three previous major tax cuts, signed into law by Presidents Johnson (1964), Carter (1978) and Reagan (1981). These were the top three initiatives since 1950 ranked by impact on existing revenues, according to a Treasury study, involving losses of 1.6%, 0.8% and 2.9% of GDP respectively. For comparison, the Tax Cuts and Jobs Act of 2017 is projected to cut revenues by 1.1% of GDP*. The three prior reductions occurred against a backdrop of rising interest rates, as now.
Surprisingly, there was a consistent pattern across the three episodes: six-month narrow money growth declined before and just after legislation was passed but then rose for 5-6 months, subsequently falling back again – fourth chart.
This pattern could reflect uncertainty about the success and details of legislation holding back spending and activity pending its passage. In addition, some beneficiaries of tax cuts may lack liquid resources or access to credit, delaying the boost to their spending until reductions flow through to disposable incomes.
The recent monetary slowdown fits the historical pattern and the suggestion is that narrow money growth will recover temporarily in Q2 and Q3 2018.
Such a revival could warrant a more positive view of US economic prospects for late 2018 / early 2019 but would not alter the forecast of a near-term slowdown. Global prospects, of course, will also hinge on developments in China, where money trends suggest an increasing risk of a “hard landing” unless the authorities reverse policy restriction soon – see previous post.
*All figures refer to static impact over four years, except 1964, which refers to full impact in single year.
Diesen Beitrag teilen: