


Janus Henderson: Leading indicators confirming monetary slowdown
The monetary forecast of a global economic slowdown over the remainder of 2018 is receiving confirmation from shorter-term non-monetary leading indicators.
03.05.2018 | 10:44 Uhr
 A March update of the widely-monitored OECD composite leading indicators is scheduled for release on 14 May. Most of the component data, however, are already available, allowing an independent calculation.
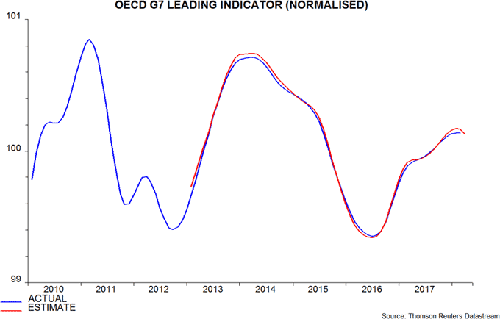
The first chart below shows the G7 normalised indicator together with the independently-calculated series, which includes a March estimate and incorporates revisions. The series levelled off in January / February and fell in March. The normalised indicator is designed to signal turning points in the level of output relative to trend, i.e. the March decline suggests future below-trend expansion.
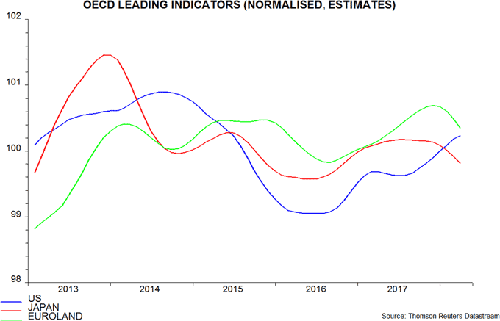
The recent reversal in the indicator has been driven by Japan and Europe, with the US component still rising – second chart.
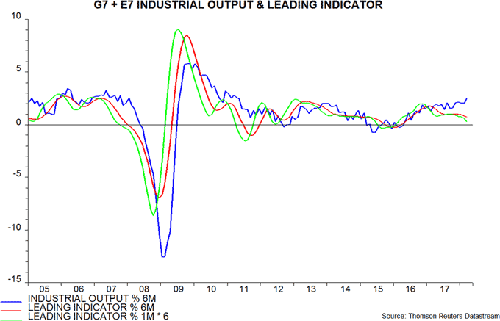
Available evidence suggests that global (i.e. G7 plus E7) six-month industrial output growth reached a seven-year high in March – third chart. Previous posts suggested that a peak would be reached around March, based on a peak in six-month real narrow money growth in June 2017 – the average lead time at turning points historically has been nine months. The chart shows six- and one-month rates of change of a trend-restored G7 plus E7 leading indicator derived from the OECD data. Six-month growth peaked most recently in November 2017; the average historical lead time has been four months, so this is also consistent with a fall in six-month output growth after March. With one-month growth of the indicator still weakening, a further fall in the six-month increase is likely.
The OECD composite leading indicators incorporate a mixture of soft data (business and consumer surveys), hard series (e.g. housing starts / permits, manufacturing new orders, auto registrations / output, average / overtime hours, the ratio of manufacturing inventories to sales) and financial market indicators (e.g. the slope of the yield curve, stock prices). Of the G7 plus E7 countries, only the indicators for Canada and India include a monetary aggregate (M1). The indicators, therefore, provide an independent, though less timely, cross-check of monetary signals.
Diesen Beitrag teilen: