


Janus Henderson: Is the stocks cycle peaking?
Incoming monetary news continues to suggest that the global economy will lose momentum over the remainder of 2018. This slowdown will probably be driven partly by a rolling over of the US / global stockbuilding or inventory cycle.
21.03.2018 | 09:46 Uhr
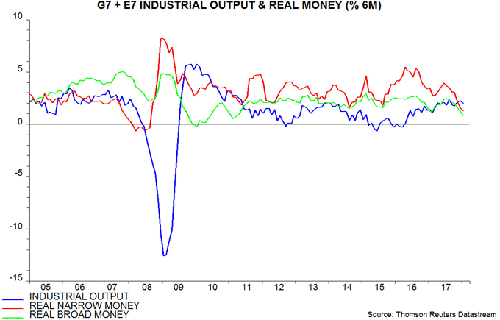
 With near-complete January monetary data now available, six-month growth of real narrow money in the G7 plus emerging E7 economies is confirmed to have fallen to its lowest level since 2008. Real broad money growth also weakened further – see first chart.
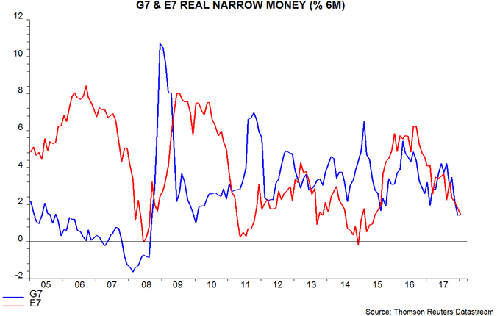
Real narrow money growth has fallen similarly in the G7 and E7 groupings, suggesting a synchronised economic slowdown across developed and emerging economies – second chart.
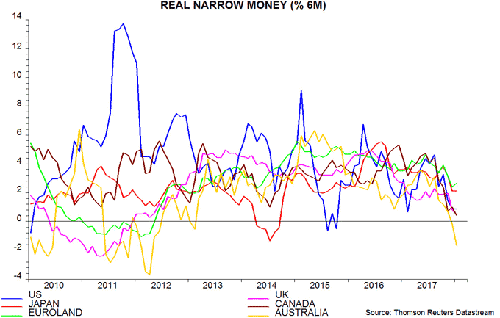
Euroland, the UK, Canada and Australia, among others, have released January monetary data over the past week. Real narrow money growth recovered slightly in Euroland – see previous post – but there were further falls in the UK and Canada; Australia, meanwhile, moved into contraction – see third chart.
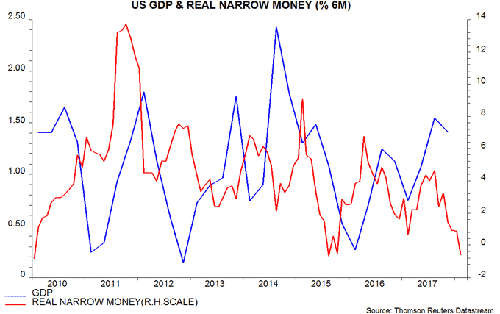
The US may have joined Australia in negative territory in February, judging from weekly data – see fourth chart*. As previously discussed, US narrow money trends rebounded strongly 3-5 months after previous large tax cuts were legislated, so we are on the alert for a recovery in the data starting over March-May.
The primary indicator used here to assess the status of the global inventory cycle is the annual change in G7 stockbuilding expressed as a percentage of GDP – equivalent, to a very close approximation, to the contribution of stockbuilding to annual G7 GDP growth. This series has reached troughs every 14 quarters on average since the 1960s, consistent with economists’ assessment based on earlier historical data of a cycle duration of between three and five years – fifth chart.
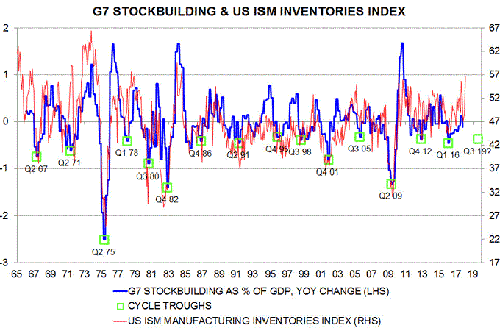
The negative impact of stockbuilding on annual G7 GDP growth reached a maximum in early 2016 – a fading of this drag was an important driver of accelerating global activity in late 2016 / 2017. The contribution turned slightly positive in the third quarter of 2017 but fell back in the fourth quarter. A reasonable hypothesis is that companies were surprised by the strength of final demand in late 2017, so were unable to increase inventories to the extent desired.
If this hypothesis is correct, firms would be expected to boost production and stockbuilding strongly in early 2018 in an effort to restore the desired ratio of inventories to sales. This appears to be happening: the US ISM manufacturing inventories index, which is based on the net percentage of firms reporting a rise in stock levels, correlates with the G7 stockbuilding growth contribution and surged in February, reaching a high level by historical standards – fifth chart.
The finished inventories index of the Markit global manufacturing purchasing managers' survey also rose sharply last month.
The expectation here is that the growth impact of G7 stockbuilding will peak in the first or second quarter of 2018, fading during the second half and turning negative ahead of the next cycle trough, which – based on the historical average cycle duration – could occur in mid-2019.
*The final data point in the chart is an estimate based on the average level of the nominal money stock in the three weeks to 19 February and an assumed 0.2% rise in consumer prices (seasonally adjusted).
Diesen Beitrag teilen: