


Janus Henderson: Chinese money trends flashing danger
Chinese data for January / February can be distorted by New Year timing effects. With this caveat, January money numbers appear notably weak, reinforcing the expectation here of a significant economic slowdown later in 2018.
15.02.2018 | 12:10 Uhr
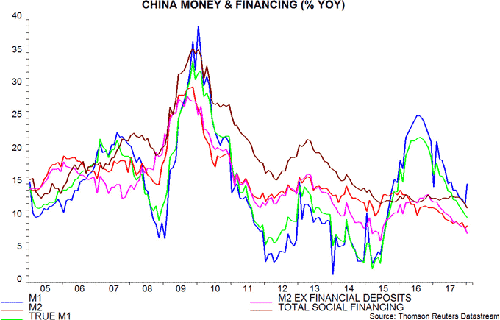
 A negative view of the data may seem odd given that annual growth rates of M1 and M2 rose between December and January – from 11.8% to 15.0% and from 8.2% to 8.6% respectively. The official measures, however, are flawed: M1 excludes household demand deposits*, which are relevant for assessing consumer spending prospects, while M2 has been distorted in recent years by large fluctuations in deposit holdings of financial institutions – such deposits appear to be uncorrelated with future spending / activity.
The analysis here, therefore, focuses on “true M1” – official M1 plus household demand deposits – and M2 excluding financial deposits. Annual growth rates of these measures, in contrast to the official M1 / M2 aggregates, continued to slide in January, reaching their lowest levels since mid-2015 – see first chart.
The preferred measure here for forecasting purposes is the six-month rate of change of real true M1 (i.e. deflated by consumer prices, seasonally adjusted). This fell sharply between August 2016 and January 2017 but then stabilised through September 2017 at a respectable historical level – second chart. This stabilisation was the basis for the view here that the Chinese economy would retain solid momentum through early 2018 – contrary to pessimistic forecasts from followers of the “credit impulse”, among others.
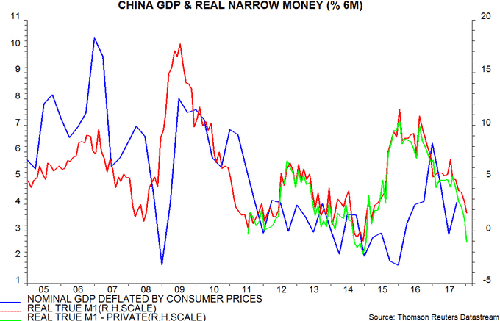
The six-month growth rate, however, resumed its decline in the fourth quarter of 2017 and fell significantly further in January. Allowing for a typical nine-month lead, this suggests economic weakness starting around mid-2018.
Demand deposits within true M1 comprise holdings of households, non-financial enterprises and government departments / organisations. The latter can be excluded to create a “private” variant of the aggregate. This measure has slowed even more sharply – second chart.
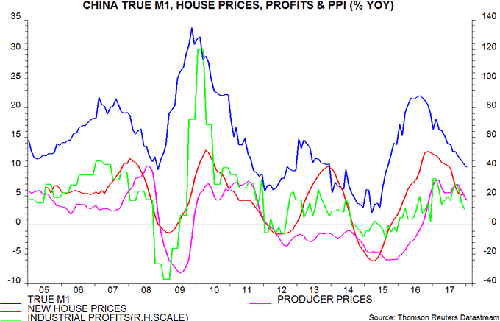
Chinese narrow money trends tend to lead house prices, industrial profits and producer prices, in that order – third chart. The monetary slowdown was reflected in a moderation of house price inflation during 2017; profits growth and producer price inflation have turned down more recently – third chart. These trends are likely to extend. Weaker economic data and easing inflationary pressures may prompt a partial reversal of recent policy tightening in mid-2018.
* Such deposits are large – equivalent to 46% of the stock of official M1 – and appear to be inversely correlated with currency in circulation and corporate demand deposits around the New Year.
Diesen Beitrag teilen: