Janus Henderson: Why is US economic news holding up?
Global data weakness conceals continued, though moderating, positive surprises in the US offset by very negative news elsewhere
29.06.2018 | 09:30 Uhr
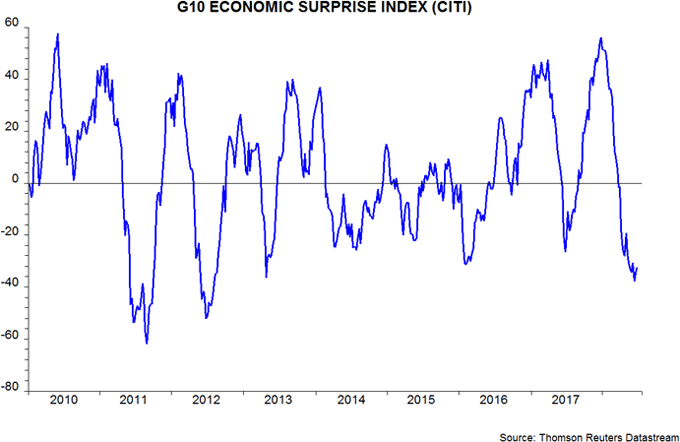
Global economic activity news has surprised negatively since March, with the Citigroup G10 composite index recently reaching its lowest level since 2012 – see first chart. This is consistent with the “monetarist” view that global economic momentum would peak in early 2018 and soften into the second half of the year.

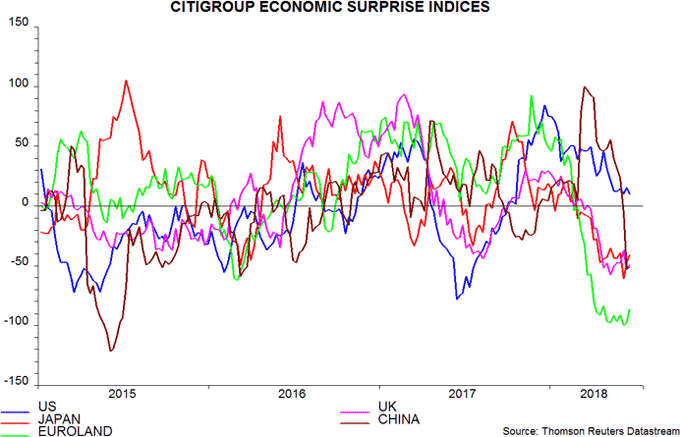
Global data weakness, however, conceals continued, though moderating, positive surprises in the US offset by very negative news elsewhere – second chart. Yet real narrow money growth – as measured by the six-month rate of change of M1 deflated by consumer prices – has been no less weak in the US than in most other major economies.

Why has US news remained resilient despite an apparently negative monetary backdrop?
An obvious answer is that fiscal stimulus has insulated the US from monetary tightness and global economic weakness. A post in December, indeed, argued – contrary to the consensus view – that US tax cuts were well-timed from a cyclical perspective, albeit reckless in terms of longer-term fiscal health.
The view here, however, was – and still is – that an effective fiscal stimulus would be signalled by a pick-up in narrow money trends. As previously discussed, such a pick-up occurred following the tax reductions in 1964, 1978 and 1981 – the three largest cuts since World War Two before the current programme (which ranks third of the four).
An alternative explanation is that US money trends have been less negative than suggested by the headline M1 data. This view is supported by additional monetary data in the Fed’s financial (flow of funds) accounts for the first quarter of 2018, released two weeks ago.
The preferred narrow money measure here for forecasting purposes is non-financial M1, comprising holdings of households and non-financial businesses. Aggregate M1 includes checkable / overnight deposits of financial institutions, fluctuations in which often reflect portfolio allocation shifts, with no economic implications.
Non-financial M1 can be calculated monthly in the Eurozone and UK, while Japanese headline money measures are non-financial by construction. In the US, by contrast, non-financial M1 is available only on a quarterly basis with a significant lag from the Fed’s financial accounts.
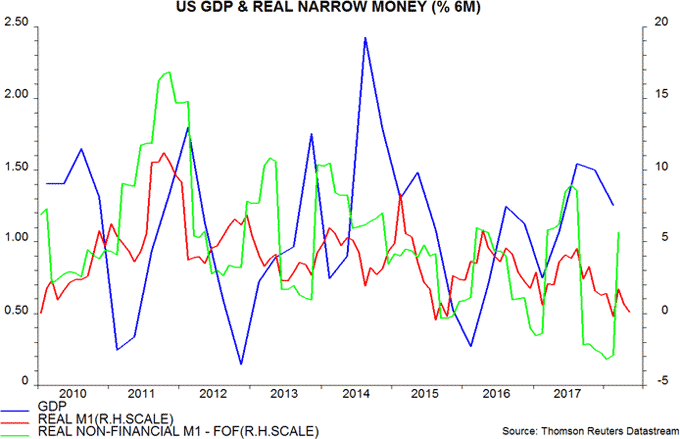
The third chart shows the two-quarter / six-month changes in US GDP and real M1 / non-financial M1. Turning points in real money momentum have consistently led turning points in GDP momentum in recent years. As expected, non-financial M1 appears to have given slightly more reliable signals.

The six-month change in real non-financial M1 was weaker than that of real M1 in the second half of 2017 but rebounded sharply in the first quarter of 2018. The financial accounts show that M1 was held back by a fall in checkable deposits of financial institutions – in particular, money market funds and government sponsored enterprises (GSEs). Money funds moved funds out of banks and the repo market in order to buy Treasury bills, probably in response to attractive interest rates caused by a surge in supply, while GSEs increased their repo lending. These shifts are unlikely to carry any significance for economic prospects.
The recovery in real non-financial M1 momentum may help to explain recent US data resilience and suggests that economic growth will continue to hold up better than elsewhere near term. The judgement here, however, remains that US monetary trends are signalling a second-half slowdown, with data likely to surprise negatively relative to upbeat consensus expectations. This judgement reflects three additional considerations.
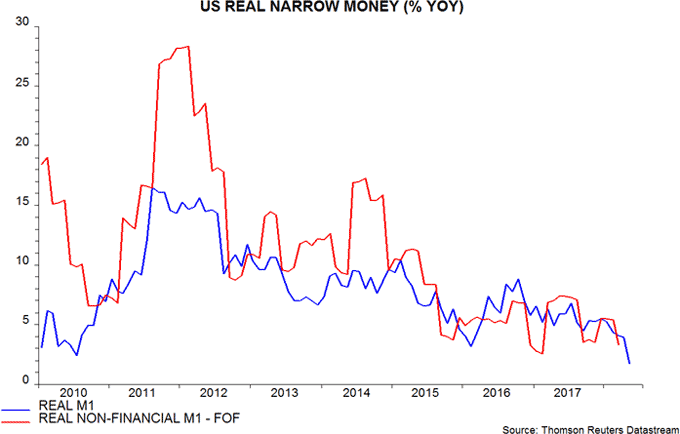
First, while the six-month change in real non-financial M1 was above that of real M1 in March, year-on-year growth rates were similar and near the bottom of the range in recent years – fourth chart.

Secondly, real M1 momentum – both six-month and year-on-year – has weakened since March. It seems likely that six-month real non-financial M1 growth will have fallen back in the second quarter, although confirmation, unfortunately, will not be possible until the next financial accounts are released in early September.
Thirdly, the rebound in the six-month change in real non-financial M1 in the first quarter partly reflected a large quarterly rise in holdings of non-financial corporations, and this increase may have been influenced by foreign earnings repatriation due to the tax changes. If so, it may represent a temporary increase in money demand as corporate balance sheets are reorganised, rather than signalling stronger business spending.


Diesen Beitrag teilen: