Janus Henderson: OECD leading indicator preview - further weakness
Global economic momentum will continue to weaken into the fourth quarter of 2018 before reviving slightly into early 2019, so Simon Ward, economist at Janus Henderson
07.08.2018 | 13:16 Uhr
The central expectation here, based on monetary trends, is that global economic momentum will continue to weaken into the fourth quarter of 2018 before reviving slightly into early 2019 – see previous post. The OECD’s composite leading indicators, which in most cases exclude money, are giving stronger support for the forecast of a near-term further economic slowdown.
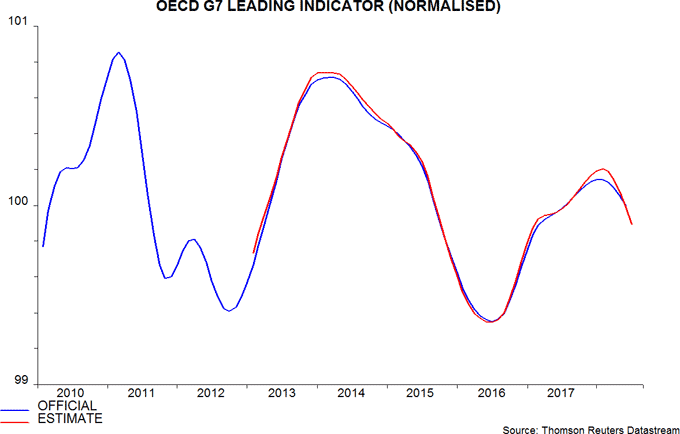
The OECD will release June data for its indicators on 8 August but most of the component information is already available, allowing an independent calculation. The G7 indicator is estimated to have fallen further in June, with revisions likely to magnify the scale / speed of the decline from a January 2018 peak – see first chart. The indicator is expressed in trend-adjusted form, i.e. the recent fall implies below-trend economic growth.

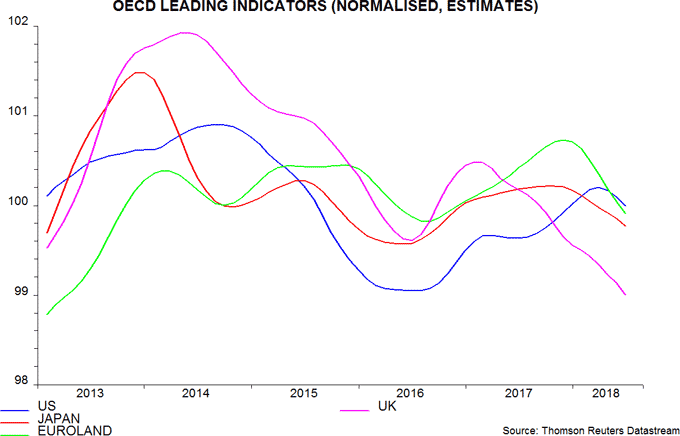
The decline in the G7 indicator was initially driven by European countries and Japan, with the US indicator continuing to rise. This raised the possibility that non-US weakness would prove temporary as US acceleration boosted global demand – the consensus view when economic data started to disappoint in early 2018.
Monetary trends, however, suggested that convergence would occur by the US losing momentum rather than a pick-up in the rest of the G7. The latest leading indicator estimates are consistent with this expectation, with the US indicator also now falling and no let-up in the declines in Europe / Japan – second chart.

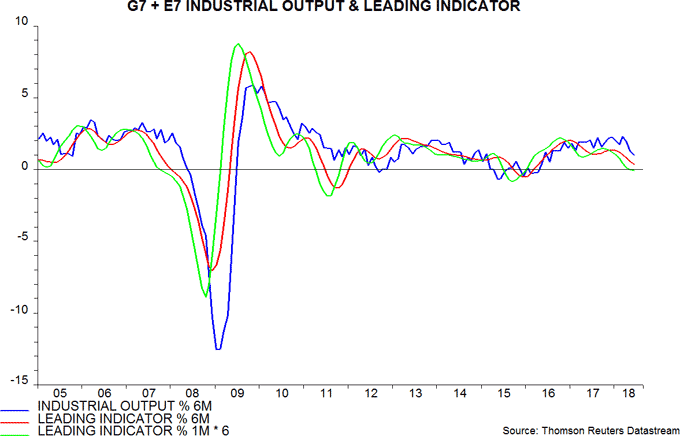
The third chart shows a “global” indicator that combines data for the G7 and seven large emerging economies (the “E7”) while “adding back” an estimate of trend industrial output growth. Six-month growth of this indicator peaked in December 2017 ahead of a March 2018 peak in G7 plus E7 six-month output expansion. It continued to decline in June, consistent with a further loss of output momentum through the third quarter, as suggested by monetary trends.

Based on the monetary forecast that economic momentum will bottom in the fourth quarter, one- and six-month changes in the G7 plus E7 leading indicator may stabilise during the third quarter.


Diesen Beitrag teilen: