
Janus Henderson: Economic slowdown on schedule
A post in January suggested that financial markets would face challenges in 2018 from a spring slowdown in the global economy and a pick-up in wage pressures in lagged response to labour market tightening. It occured as proposed.
14.09.2018 | 11:33 Uhr
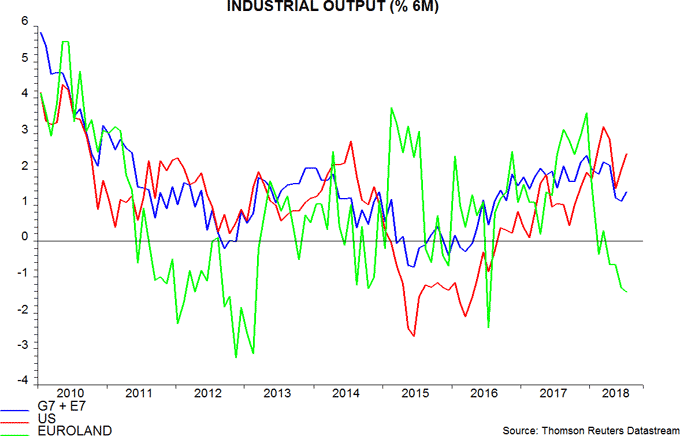
The economic slowdown occurred on schedule: six-month growth of industrial output in the G7 and seven large emerging economies fell sharply between April and June, though recovered in July*. The loss of momentum, however, occurred outside the US and was focused on Euroland in particular – see first chart.
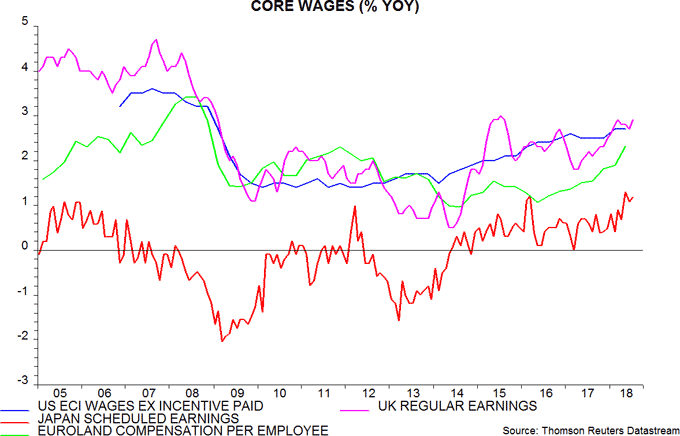
Measures of core wage growth, meanwhile, have firmed – second chart. Unemployment rates have fallen further this year while headline consumer price inflation has risen, suggesting that the uptrend in pay growth will extend into 2019.
Market prospects depend importantly on how current US / rest of the world economic divergence is resolved. Monetary and leading indicator evidence argues that a softening of US momentum is more likely than a reacceleration in the rest of the world.
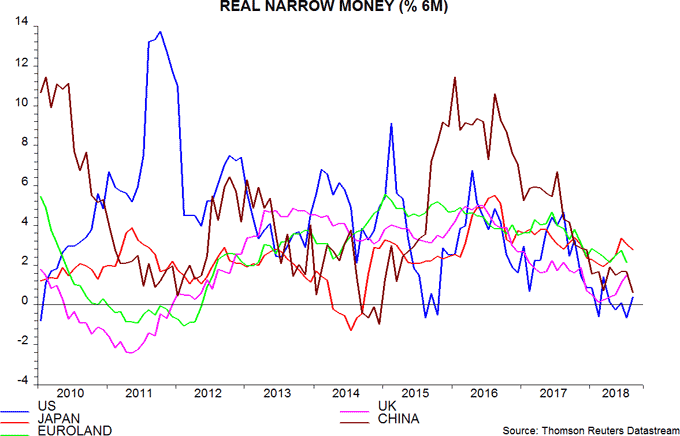
The six-month change in US real narrow money appears to have recovered in August but remains very weak – third chart**. Second-quarter financial accounts released next will provide information on sectoral monetary trends, which could affect the assessment of economic prospects here.
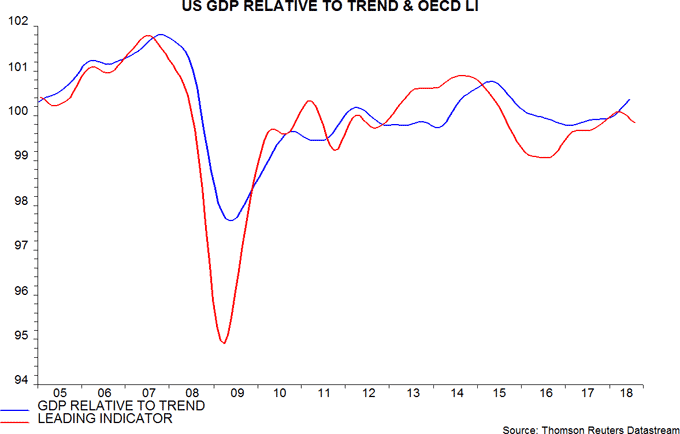
As expected, the OECD's US leading indicator fell further in July; a decline implies below-trend GDP growth, with trend currently estimated at 2.3% per annum – fourth chart.
Narrow money developments outside the US, meanwhile, have yet to suggest a reversal of recent economic weakness. Six-month growth of Chinese real narrow money, indeed, appears to have fallen further in August despite a shift to less restrictive policies since April – third chart***.
A second key issue for markets is whether faster labour cost growth feeds through to core consumer price inflation, forcing monetary policies to shift hawkishly relative to current plans, or else squeezes profit margins. The bias here is in favour of the latter scenario.
Firms may struggle to pass on cost increases against a backdrop of slowing demand and restrictive monetary conditions. Measures of business operating profits outside the US have already lost momentum as wage bills have risen faster than nominal GDP – fifth chart.

Incipient profits weakness is consistent with the global business investment cycle being at or near a peak – see previous post.
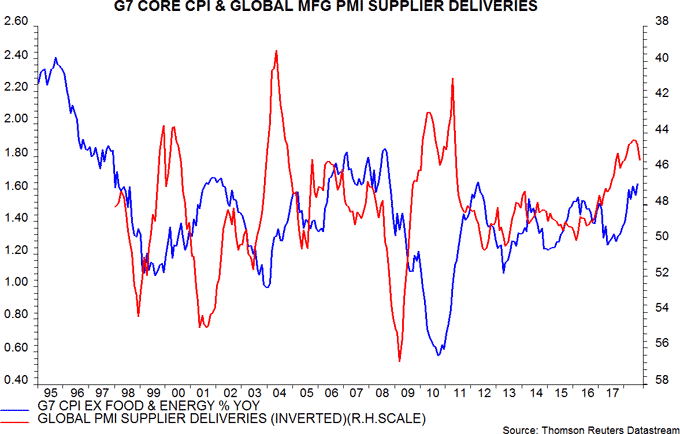
The imposition of tariffs and associated supply chain disruption pose an upside risk to the view that core inflation will not rise significantly further. Supply pressures are reflected in the low level of the global manufacturing PMI supplier deliveries index (lower = longer delivery times). Swings in this index have shown an inverted leading relationship with movements in G7 core consumer price inflation – sixth chart. The index, however, has recovered slightly since June; a renewed fall would warrant concern that core inflation is still some way from a peak.
*Output growth was marginally above six-month real narrow money growth in July, so the first equities / cash switching rule discussed in a previous post will move to cash at end-September, barring data revisions.
**M1A divided by consumer prices. August estimate based on weekly monetary data through 27 August and assumed 0.2% rise in consumer prices.
***True M1 = official M1 plus household demand deposits. August partly estimated.


Diesen Beitrag teilen: