


Janus Henderson: Chinese money trends still expansionary
A fall in Chinese money growth since late 2016 has been reflected in an easing of inflationary pressures rather than a loss of economic momentum. Current monetary trends are judged here to remain consistent with respectable economic expansion, while the PBoC has started to reverse recent policy tightening, which may prevent a further slowdown.
18.07.2017 | 14:01 Uhr
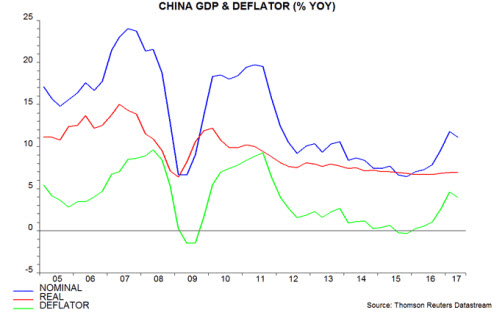
Annual growth of real GDP was 6.9% in the second quarter, unchanged from the first quarter and above the consensus forecast of 6.8%. Nominal GDP growth fell from 11.8% to 11.1%, reflecting a slowdown in the price deflator – see first chart.
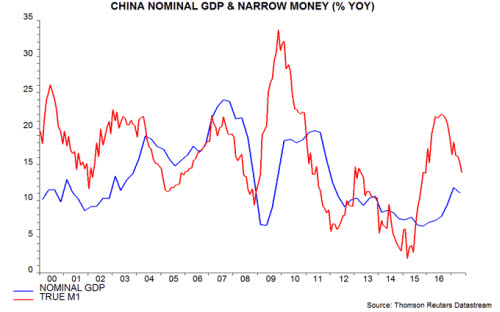
The decline in nominal expansion is consistent with an earlier fall in annual narrow money growth, as measured by “true” M1*, from a peak in August 2016. This eased further to 13.9% in June but is much stronger than in 2014 / early 2015, when the economy was at risk of serious weakness / deflation – second chart.
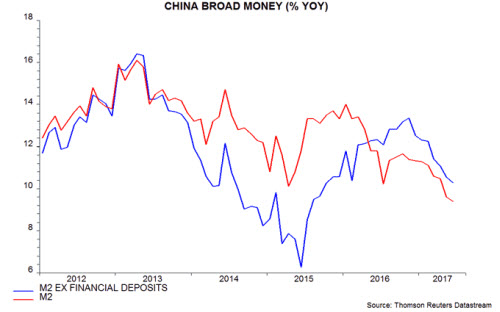
Similarly, broad money growth, as measured by M2 excluding financial sector deposits**, fell to 10.3% in June but has retraced less than half of its rise between mid-2015 and late 2016 – third chart.
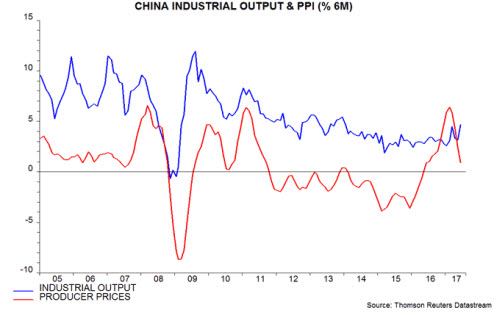
The transmission of slower money expansion to prices rather than activity is highlighted by producer price / industrial output data. Six-month PPI inflation eased from 5.8% in February to 0.7% in June, while six-month industrial output growth rose to 4.7% in June, a 42-month high – fourth chart.
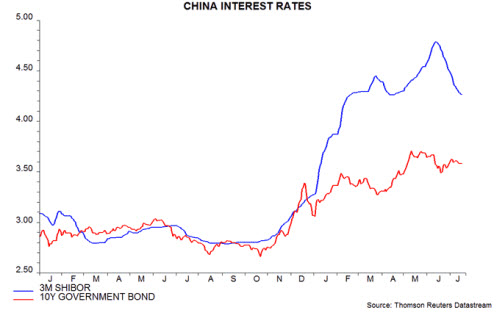
A further monetary slowdown would raise the risk of economic damage but easing inflation and currency stability have allowed the PBoC to start reversing first-half policy tightening. Three-month SHIBOR has fallen back to its April level, although seasonal factors may also have played a role – fifth chart.
A constructive economic view will be maintained here barring a further decline in money growth. External risks may be more significant – a change in US trade policy and / or a strong rebound US economic growth later in 2017, resulting in upward pressure on US rates / the dollar and a reacceleration of Chinese capital outflows.
*True M1 = currency in circulation plus corporate / household demand deposits. The official M1 measure includes only corporate deposits.
**Financial sector deposits are volatile and contain little information about future spending on goods and services. Such deposits surged in 2014-15 but have stagnated in 2016-17, i.e. they gave a significant boost to M2 growth in 2014-15 but are now exerting a drag.
Diesen Beitrag teilen: