
Janus Henderson: US money trends suggesting stable inflation
Are worries about a sharp increase in US inflation justified? This question is dedicated to Simon Ward, economist at Janus Henderson.
22.11.2018 | 10:06 Uhr
A post in September 2017 argued that the Fed would become more hawkish as the unemployment rate moved below 4%, partly reflecting concern about a replay of the 1960s, when inflation rose sharply after this level was crossed. A key difference, however, from the 1960s is that broad money trends remain subdued, which may be helping to contain inflation expectations. With the economy expected to slow over coming quarters, an inflation break-out is deemed here to be unlikely.
The earlier post suggested that solid economic growth and 1960s redux concerns would cause the Fed to hike rates by more than the consensus expected in 2018. At the time, the median projection for the three-month Treasury bill rate in the third quarter of 2018 was 1.7%, according to the Philadelphia Fed survey of forecasters. The outturn was 2.1%, with the rate currently at 2.4%.
The first and second charts illustrate the similarity of inflation / unemployment trends in the first half of the 1960s and in recent years. Core inflation remained in a narrow range below 2% despite a multi-year decline in the jobless rate. After the latter moved below 4% in February 1966, however, core inflation surged to more than 3% within a year. In econo-speak, the Phillips curve was flat at unemployment rates above 4% but steepened sharply once this level was crossed.
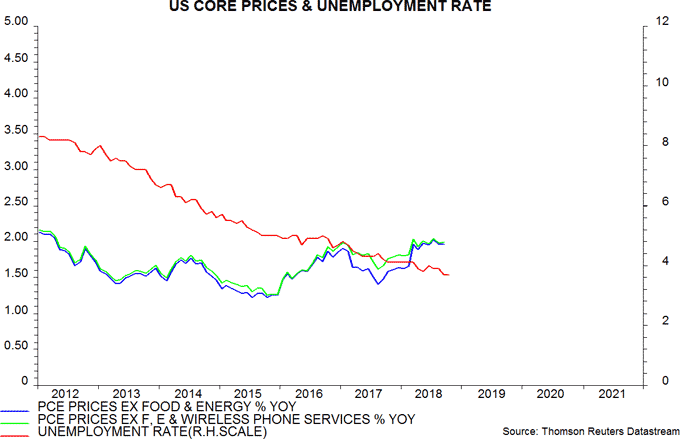
The unemployment rate fell below 4% in April 2018. While core inflation has firmed, this partly reflects the dropping-out of last year’s large cut in wireless phone charges and a break-out of the range of recent years has yet to occur – September’s 2.0% reading was below a post-recession peak of 2.1% in 2012.
One possible explanation for the difference is that monetary trends have been much weaker than in the 1960s. The third and fourth charts superimpose annual broad money growth, as measured by non-financial M3, derived from data in the Fed’s quarterly financial accounts. Money growth was robust – 8% plus – for several years ahead of the 1966 inflation break-out. It has averaged 5.0% since 2012, recently falling below this level.
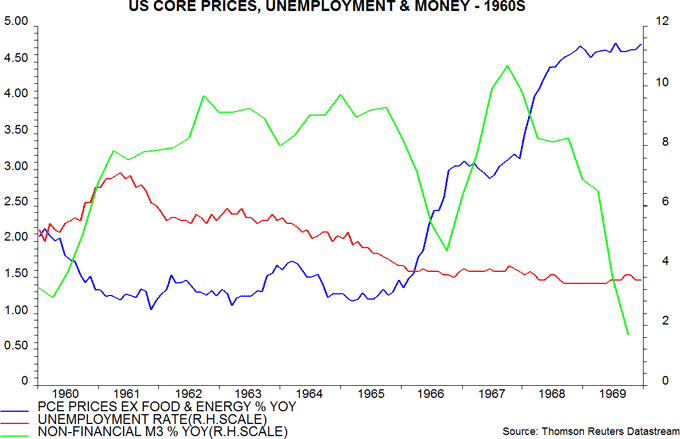
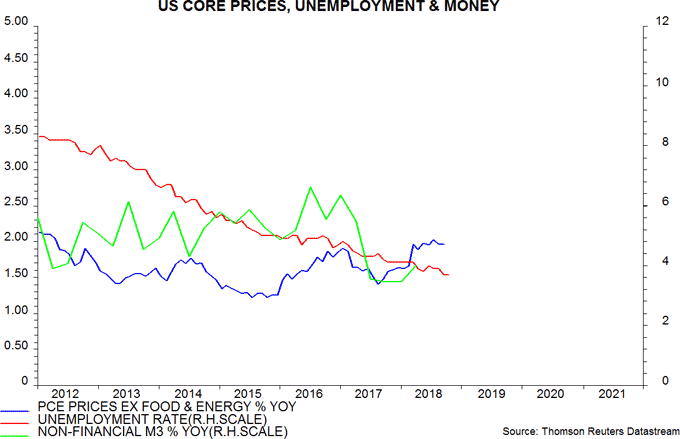
High money growth in the 1960s may have contributed to inflation expectations becoming “unanchored”, resulting in a wage / price spiral. Direct measures of inflation expectations, unfortunately, are unavailable for the period but economists’ inflation forecasts rose sharply in 1965-66, which could be indicative of a broader shift – the median one-year ahead projection for CPI inflation increased by 1 percentage point between June 1965 and June 1966, the largest change over 12 months since 1954, according to the Livingston survey (which has a longer history than the Philadelphia Fed survey).
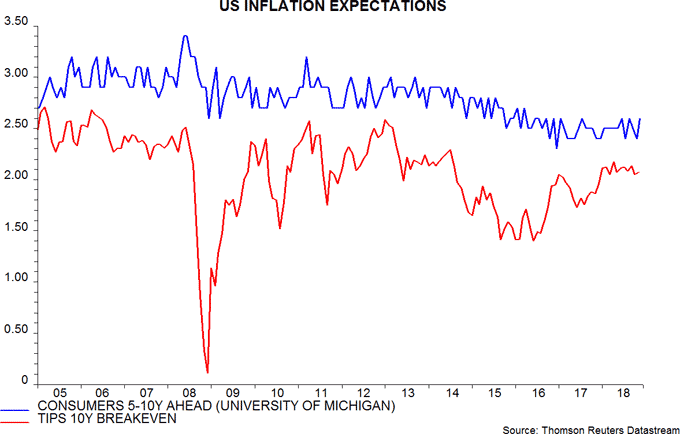
Consumer and market inflation expectations have remained stable recently, as have economists’ forecasts – fifth chart.
Broad money growth fell sharply in 1966, foreshadowing a significant economic slowdown in 1967, which arrested the decline in the unemployment rate and stabilised core inflation temporarily – third chart. Recent weaker money trends – narrow as well as broad – suggest a similar scenario for 2019. The window for a break-out in core inflation, therefore, may be closing. A sustained rise remains plausible over the medium term, assuming that a weaker economy in 2019 prompts a Fed policy reversal and an associated rebound in money growth.


Diesen Beitrag teilen: