
Janus Henderson: US economy slowdown ahead
Global narrow money trends have stabilised since early 2018 but continue to signal a weak economic outlook. An upside risk is a revival in Chinese money growth in response to recent policy easing.
30.07.2018 | 13:19 Uhr
Global narrow money trends have stabilised since early 2018 but continue to signal a weak economic outlook. US narrow money has stagnated in real (i.e. inflation-adjusted) terms, suggesting that the US economy will lose momentum during the second half of the year, a forecast supported by a recent fall in the OECD’s US composite leading indicator (which excludes money). An upside risk to the gloomy global assessment here is a revival in Chinese money growth in response to recent policy easing. Such a revival, however, would be unlikely to be reflected in economic data until end-2018 at the earliest.
Six-month growth of real narrow money in the G7 economies and seven large emerging economies (the “E7”) is estimated to have risen slightly in June, based on monetary data covering about two-thirds of the aggregate and full consumer price information. If confirmed, the June reading would be the highest since November 2017 – see first chart.
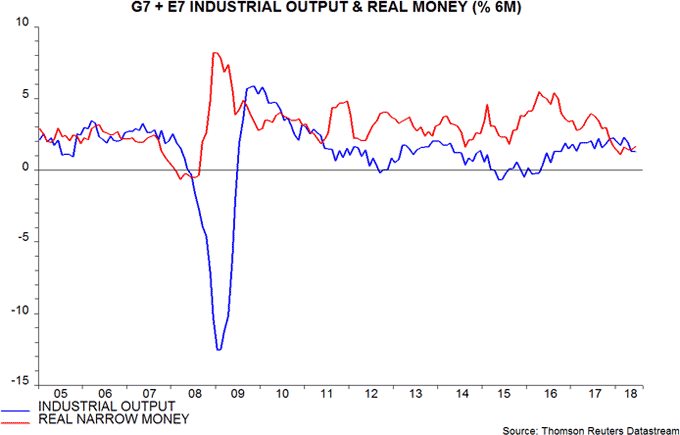
The fall in real narrow money growth between June 2017 and February 2018 is now being reflected in a slowdown in industrial output, six-month growth of which peaked in March and fell sharply in May; partial data suggest a stabilisation in June*. With real money growth recovering since February, industrial output momentum may bottom around November 2018 and revive into early 2019, allowing for a typical nine-month lead.
Global real narrow money growth, however, remains below its range between September 2008 and November 2017, suggesting weak economic expansion by the standards of recent years.
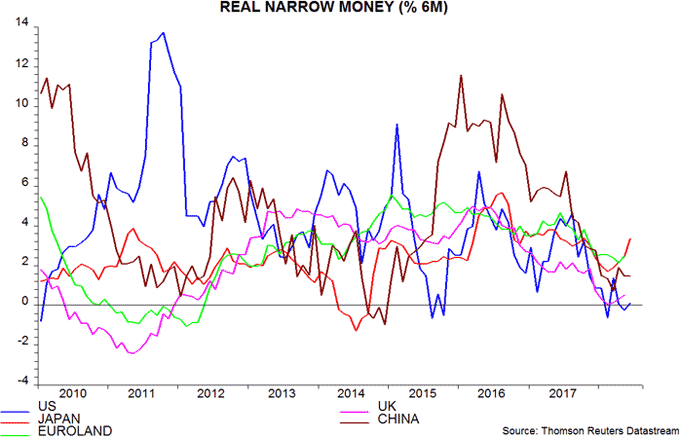
Real narrow money growth has recovered in Japan and, to a much lesser extent, China but monthly US data remain weak – second chart. The US narrow aggregate tracked here, M1A**, was unchanged in real terms (i.e. relative to consumer prices) between August 2017 and June 2018.
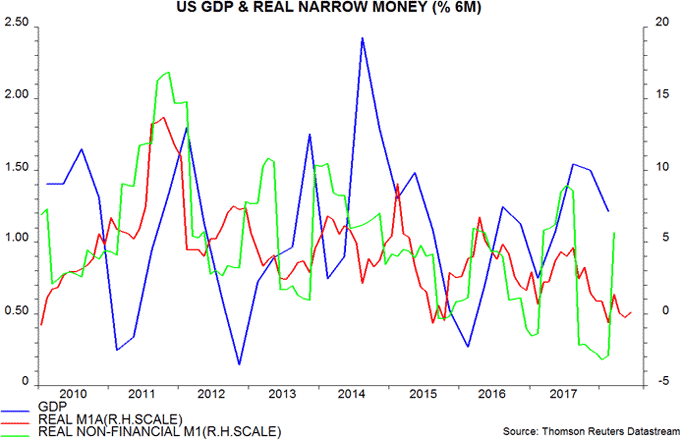
A previous post noted that US non-financial M1, which is available quarterly, outpaced M1 and M1A in early 2018, helping to explain recent economic strength – third chart. Divergences, however, are usually temporary and this aggregate probably slowed significantly in the second quarter – data, unfortunately, will not be available until early September.
The suggestion that the US economy will lose momentum during the second half is supported by the OECD’s composite leading indicator, which is estimated to have fallen in June, with earlier data revised weaker – fourth chart. The indicator is expressed in trend-adjusted form, i.e. the recent decline implies a switch from above- to below-trend expansion.
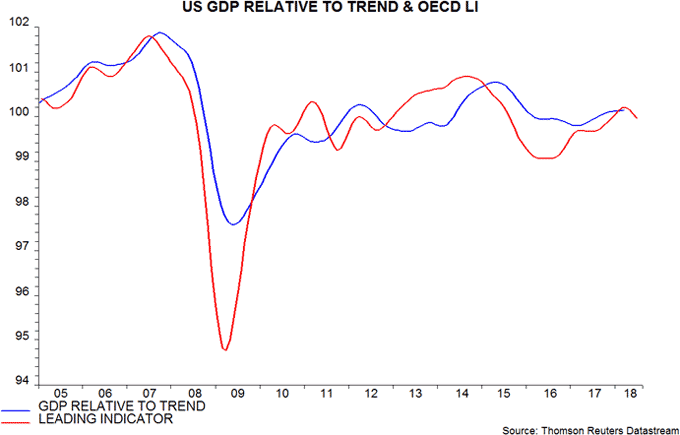
Six of the seven indicator components are now falling relative to trend, i.e. housing starts, consumer sentiment, average weekly hours worked in manufacturing, the ISM manufacturing purchasing managers’ index, share prices and the slope of the yield curve. The sole rising component is new orders for durable goods.
According to the revised estimates, the US indicator peaked in March, which compares with a November 2017 peak in the companion Euroland leading indicator. Euroland economic news started to surprise negatively from March 2018, four months after the leading indicator peak. US economic surprises have recently moved from positive to neutral and may be about to turn negative.
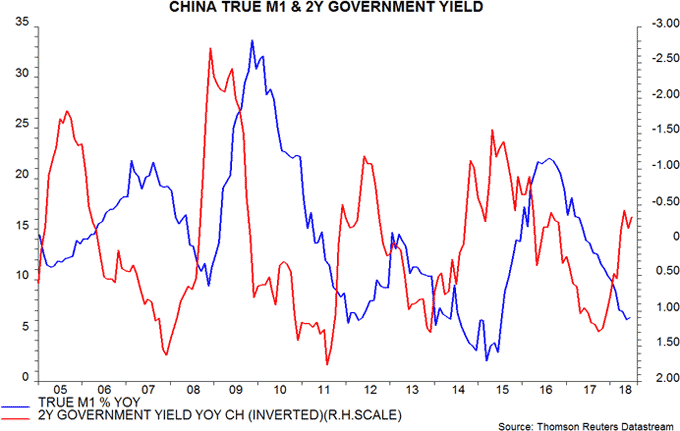
With G7 monetary policies tightening in terms of both rates and the pace of QE, any near-term pick-up in global real narrow money growth is likely to depend on a revival in China. As noted, Chinese monetary momentum appears to have bottomed and the historical relationship with the change in the two-year government bond yield, inverted, suggests a recovery ahead – fifth chart. The impact of policy stimulus, however, could be offset by a market-driven tightening of credit conditions and / or capital outflows.
* Output series adjusted to exclude large May fall in Brazil due to truckers’ strike.
** M1A = currency plus demand deposits.


Diesen Beitrag teilen: