
Janus Henderson: Six of the best - recent economic news highlights
The core rate decline contradicts the consensus forecast last year, based on Phillips’ curve “theory”, that rising capacity use and labour market tightening would boost underlying inflationary pressures.
25.04.2019 | 13:51 Uhr
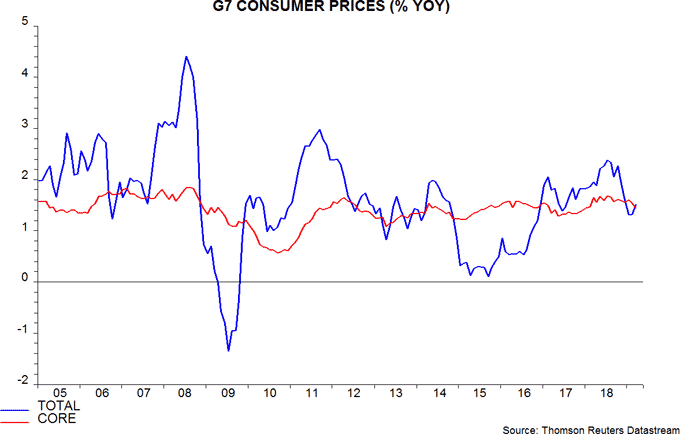
G7 headline consumer price inflation was pushed up by rising energy costs in March but the core rate subsided to a 14-month low – see first chart. The core decline contradicts the consensus forecast last year, based on Phillips’ curve “theory”, that rising capacity use and labour market tightening would boost underlying inflationary pressures.
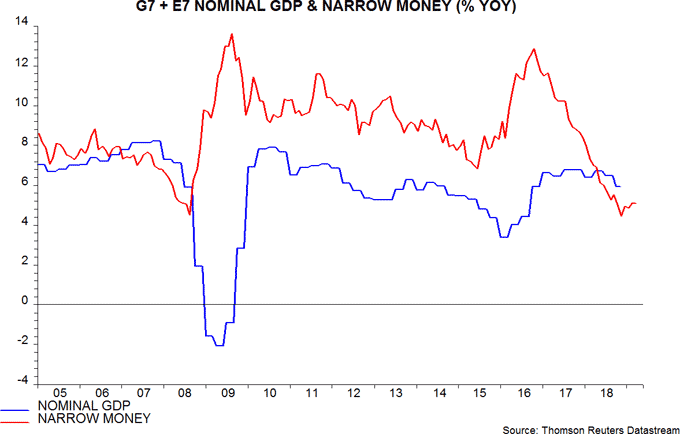
The core slowdown, however, is consistent with the “monetarist” rule of thumb that inflation follows monetary trends with a long and variable lag, averaging about two years. Global annual narrow money growth peaked in late 2016 and subsequent weakness is now being reflected in falling nominal GDP expansion, a trend likely to continue into 2020 – second chart.
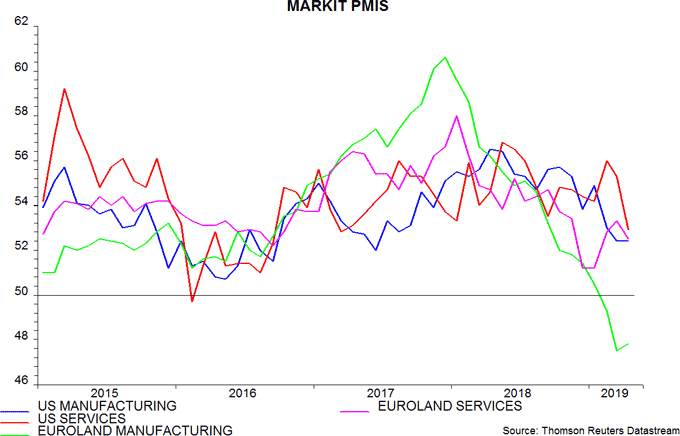
April “flash” PMI results for the US and Euroland showed a stabilisation of manufacturing indices after recent falls. As expected, however, economic weakness is now spreading to services – third chart. This broadening-out increases conviction that labour market resilience will be next to crumble.
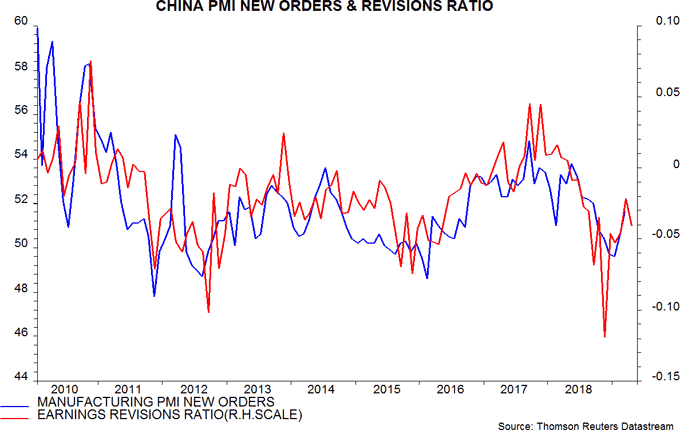
Global growth hopes were boosted by sizeable rises in official and Markit Chinese manufacturing PMIs in March but the results were probably affected by forward purchasing to maximise tax relief ahead of a VAT cut from 1 April. Earnings forecast revisions by equity analysts have remained soft – fourth chart. Will April PMI results next week disappoint.
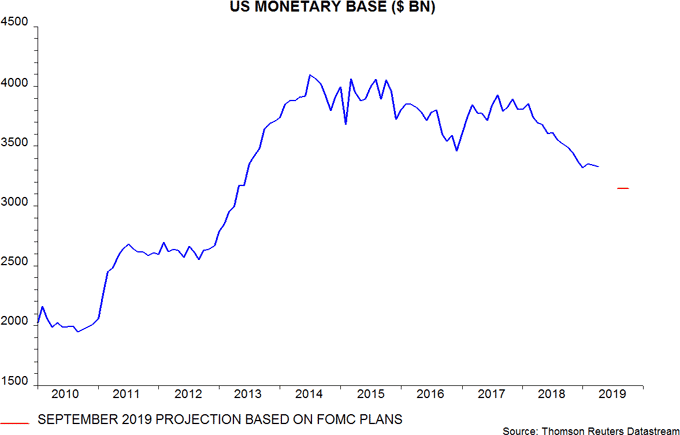
Resurgent investor confidence also reflects a belief that monetary policy-makers “have your back” following the Fed’s U-turn on interest rate guidance and dovish shifts by other major central banks. Fed policy, however, is still tightening because of the delayed ending of QT, with the monetary base projected to contract by a further 6% by end-September – fifth chart.
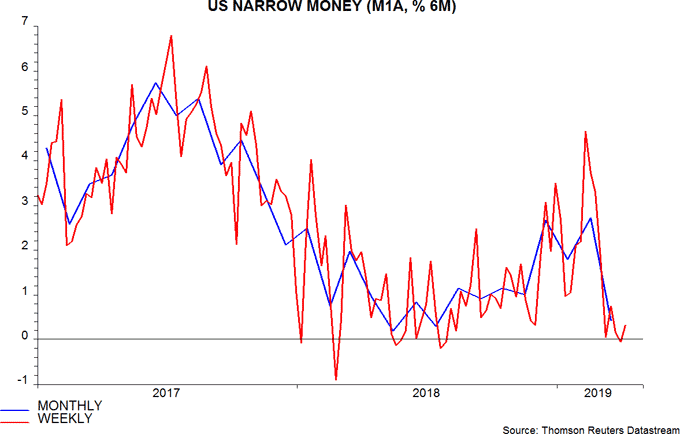
Markets have ignored a string of negative US activity reports – the Citi economic surprise index is at a two-year low – but narrow money trends suggest further weakness ahead. Six-month money growth slumped in March, with no recovery in early April – sixth chart.


Diesen Beitrag teilen: