Janus Henderson: Euroland slowdown on track but money trends stable
Euroland narrow money trends signalled the current economic slowdown and now suggest that momentum will stabilise at a weak level in early 2019.
02.11.2018 | 10:32 Uhr
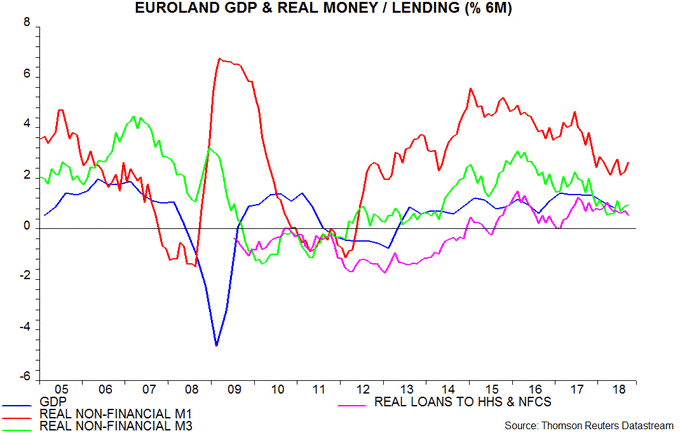
Six-month growth of real narrow money, as measured by non-financial M1 deflated by consumer prices, peaked in June 2017 and fell sharply through April 2018, reaching a five-year low. Allowing for a typical nine-month lead, this suggested that two-quarter GDP growth would top out in early 2018 and decline through year-end.
The slowdown, in the event, started slightly earlier, possibly reflecting euro strength during 2017. Two-quarter GDP expansion fell from 1.3% in the fourth quarter of 2017 to 1.1% in the first quarter of 2018 and 0.8% in the second quarter – see first chart.

Purchasing managers’ surveys signal a further loss of momentum since mid-year. The October flash reading of the composite output index is consistent, according to the survey compiler, with GDP expansion of only 0.3% per quarter.
Money trends, however, have stabilised since early 2018, with six-month real narrow money growth slightly higher in September than at end-2017. Real broad money – non-financial M3 – expansion has also edged up.
This may prove to be a pause before further deterioration but the implication is that GDP momentum will stabilise at a weak level in early 2019, in which case purchasing managers’ indices may find a bottom soon, although a recovery is unlikely.
The expectation here remains for GDP to rise by 0.25-0.35% per quarter, below the September ECB staff central forecast of quarterly growth of 0.4% in the second half of 2018, rising to 0.5% during 2019 – such a reacceleration now seems wildly unrealistic.
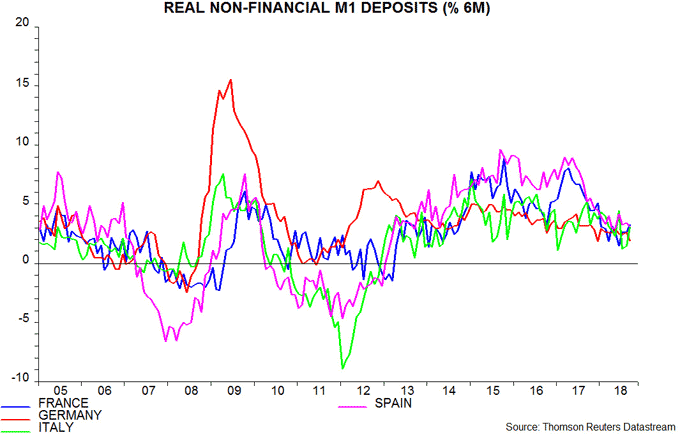
The Italian fiscal crisis and associated rise in the sovereign yield spread have yet to be reflected in any relative weakness of Italian money trends. Six-month growth of real non-financial M1 deposits was similar across the big four economies in September – second chart.


Diesen Beitrag teilen: