Janus Henderson: Euroland money numbers - mixed signals
Euroland monetary trends have stabilised since mid-2018, suggesting weak GDP growth in the first half of 2019 but no further slowdown, so Simon Ward, economist at Janus Henderson.
07.01.2019 | 10:54 Uhr
The sectoral breakdown of the latest numbers, however, is troubling: corporate narrow money trends have deteriorated, particularly in Germany, signalling likely business retrenchment.
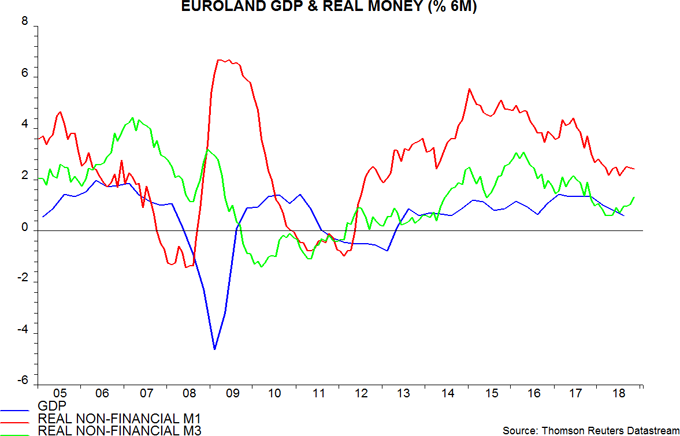
Six-month growth of real narrow money, as measured by non-financial M1 deflated by consumer prices, edged down in November but remained above a double-bottom low in April / July 2018. The corresponding growth rate of the broader real non-financial M3 measure rose further to an 11-month high, having bottomed in March / April – see first chart.

GDP appears to have grown at an annualised rate of only about 1% during the second half of 2018, well below ECB and consensus expectations. The headline money trends suggest little or no improvement during the first half of 2019. The December ECB staff forecast of a rebound in growth to 0.5% per quarter, or 2.0% annualised, looks fanciful.
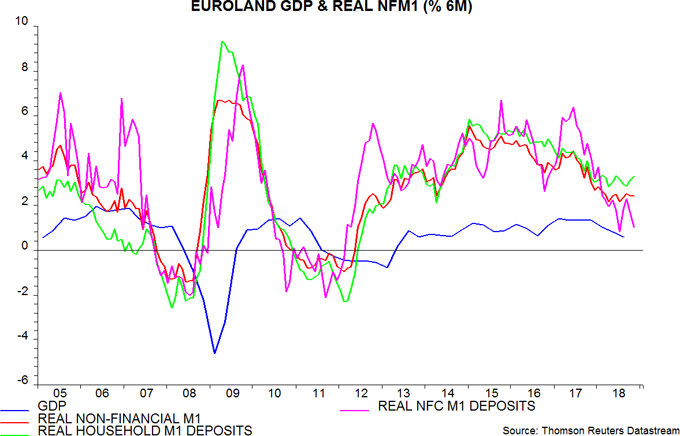
The sectoral breakdown of non-financial M1 deposits reveals a divergence between resilient household and weak corporate trends. Six-month growth of real deposits of non-financial corporations (NFCs) fell in November and is back near July’s six-year low – second chart. The concern is that corporate money weakness is signalling further cuts to investment and hiring plans, with knock-on effects to household incomes and money demand. Corporate money often leads household and aggregate trends, e.g. before the 2011-12 recession and the subsequent recovery.

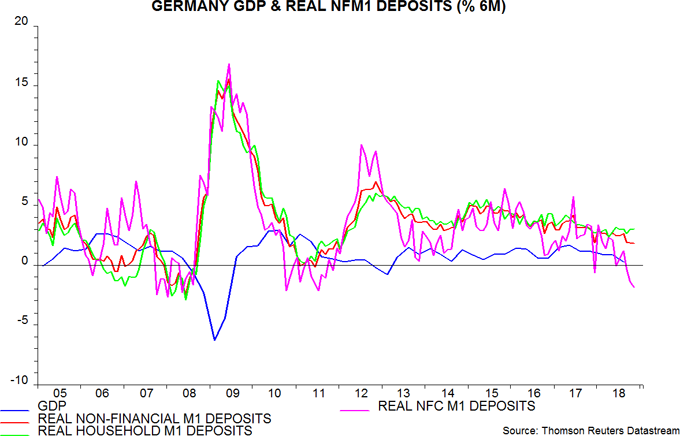
The country breakdown shows that corporate real M1 deposits have contracted in Germany and Italy, contrasting with a recent recovery in growth rates in France and Spain. German weakness is comparable with that observed before the last two recessions – third chart.

Die vorstehenden Einschätzungen sind die des Autors zum Zeitpunkt der Veröffentlichung und können von denen anderer Personen/Teams bei Janus Henderson Investors abweichen. Die Bezugnahme auf einzelne Wertpapiere, Fonds, Sektoren oder Indizes in diesem Artikel stellt weder ein Angebot oder eine Aufforderung zu deren Erwerb oder Verkauf dar, noch ist sie Teil eines solchen Angebots oder einer solchen Aufforderung.
Die Wertentwicklung in der Vergangenheit ist kein zuverlässiger Indikator für die künftige Wertentwicklung. Alle Performance-Angaben beinhalten Erträge und Kapitalgewinne bzw. -verluste, aber keine wiederkehrenden Gebühren oder sonstigen Ausgaben des Fonds.
Der Wert einer Anlage und die Einkünfte aus ihr können steigen oder fallen. Es kann daher sein, dass Sie nicht die gesamte investierte Summe zurückerhalten.
Die Informationen in diesem Artikel stellen keine Anlageberatung dar.


Diesen Beitrag teilen: