
Janus Henderson: Is UK labour market resilience about to crumble?
Last week’s UK labour market report was superficially strong but cracks are appearing under the surface. A stalling of employment and a rise in unemployment would probably put the MPC’s rate-hiking plans on indefinite hold.
08.06.2018 | 11:34 Uhr
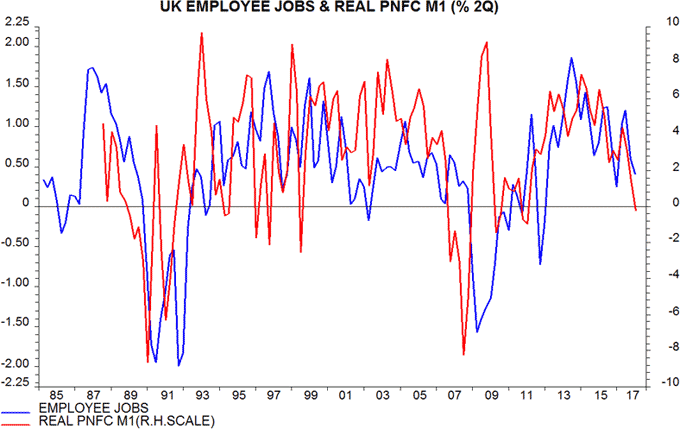
We are on the alert for a deterioration in labour market data in view of recent weak corporate money trends – six-month growth of real M1 holdings of private non-financial corporations (PNFCs) fell to zero in March. This may reflect downward pressure on profits and is likely to signal weaker prospects for business investment and hiring. Similar falls in real corporate money growth historically have usually been followed by a slowdown or outright fall in jobs – see first chart.
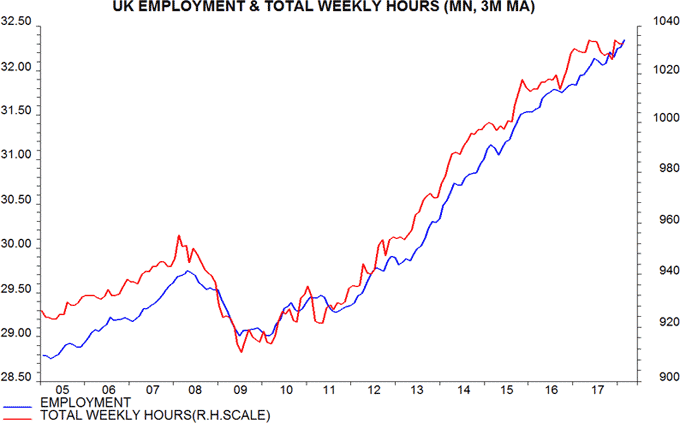
The labour force survey measure of employment continued to rise solidly in the latest three months and is up by 1.2% from a year ago. Total hours worked, however, increased by only 0.3% over the same period – second chart. Employment, that is, has been supported by a fall in average weekly hours, which may be an early sign of softening labour demand.
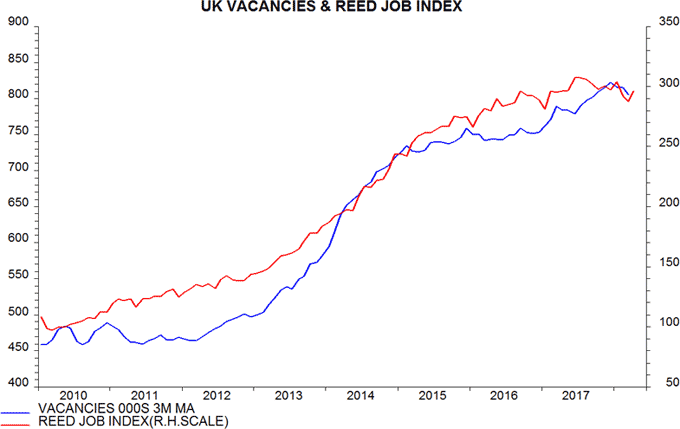
Consistent with this interpretation, the official vacancies series, based on a survey of employers, has fallen for three consecutive months, while online postings on reed.co.uk, the UK’s largest jobs board, remain below a peak reached in June / July 2017 – third chart.
The labour force grew by 0.8% over the last year, close to its average rate of increase since 2005, with a net exodus of foreign nationals offset by domestic population expansion and a further fall in inactivity. A decline in growth is likely as weaker labour demand curbs the outflow from inactivity but this may not fully offset a slowdown in jobs, implying an increase in unemployment.
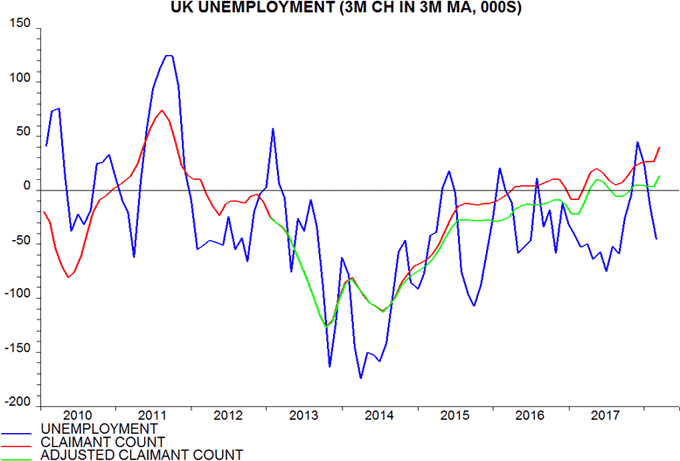
While the labour force survey unemployment measure fell further in the latest three months, a rise in the claimant count gathered pace – fourth chart. The claimant count has been distorted by the roll-out of universal credit, which has resulted in some people who would not have claimed job-seekers’ allowance (JSA) under the previous system being required to search for work. The green line is an adjusted series based on the assumption that one in two of new universal credit claimants with a requirement to look for work would not have claimed JSA under previous arrangements. This assumption is arbitrary but does not seem unreasonable; the suggestion is that the claimant count would be rising under the old system.
Quarterly data on gross flows into and out of unemployment are consistent with the jobless rate being at or near a low. The fifth chart shows a “steady state” unemployment rate to which the actual rate would converge if inflow and outflow rates were to remain at their levels in the latest quarter, based on the method of Barnichon and Nekarda. The steady state rate sometimes leads the actual rate and may have bottomed in the third quarter of 2017.
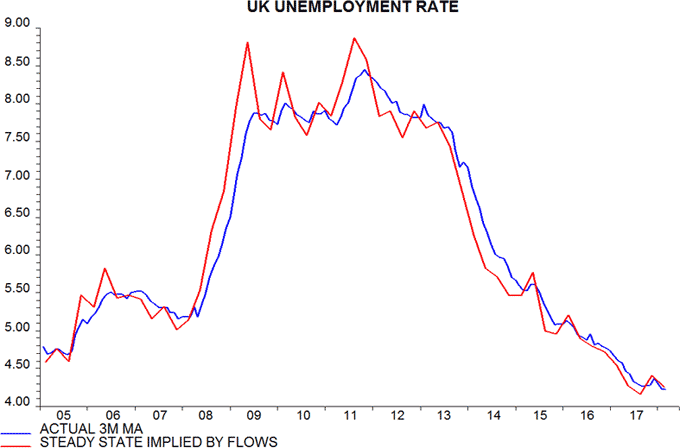
Any rise in the unemployment rate would be a shock to the MPC, with the May Inflation Report forecasting a further fall from the current 4.2% to 4.0% in early 2019, based on market interest rate expectations.


Diesen Beitrag teilen: