Morgan Stanley IM: Equity Market Commentary - August 2022

Marktkommentar

The epic battle between bulls and bears has raged throughout 2022. In his August TAKE, senior portfolio manager Andrew Slimmon makes the case that Mr. Market may be showing signs of optimism while Wall Street strategists remain overwhelmingly pessimistic.

26.08.2022 | 10:00 Uhr

Here you can find the complete article


Who Do You Listen To?

The battle between the bears and the bulls at the intersection of Wall and Broad appears as epic as ever.

In the bear corner are major Wall Street firms’ strategists.

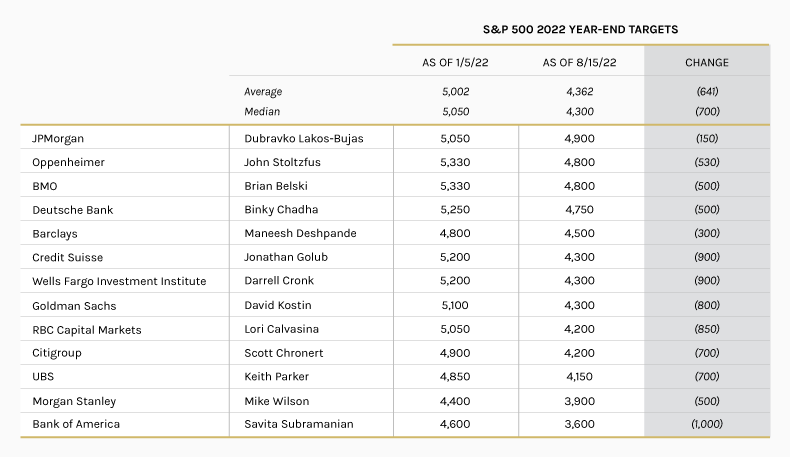
Chart 1 shows their beginning of the year 2022 S&P 500 year-end targets and those same targets as of August 15th.

Chart 1
10271006-Chart-1.png

Source: Fundstrat, Bloomberg, CNBC


Every strategist is more pessimistic today than they were at the beginning of the year.

With a median year-end target of 4,300 for the S&P, that’s a potential 2% return from where we sit today, as of August 22. This is certainly no reason to be anything but cautious.

  • In many ways, the increasingly clouded macro picture explains the higher pessimism today versus the beginning of the year. Russia’s invasion of Ukraine and the protracted war’s impact on gas and food prices were certainly not on investors’ radar and is one of the many reasons why inflation is proving to be far stickier today than expected.
  • As a result, the Fed has pursued a far more hawkish path, reminding us of the adage, “Don’t fight the Fed”.
  • Not to mention, at an 18.8x forward P/E, the market does not appear all that cheap1

Clearly, a majority of strategists would consider this recent rally to be a “bear market rally”.

Meanwhile, over in the bull corner is … “Mr. Market”.

Despite all the negative headlines that are undoubtedly driving the bearish sentiment above, the market internals are flashing a far more optimistic tone.

  1. The S&P 500 has put in an awe-inspiring recovery since its June 16th low. The extent of the rally historically suggests far more than a simple “bear market rally.”

    Consider:

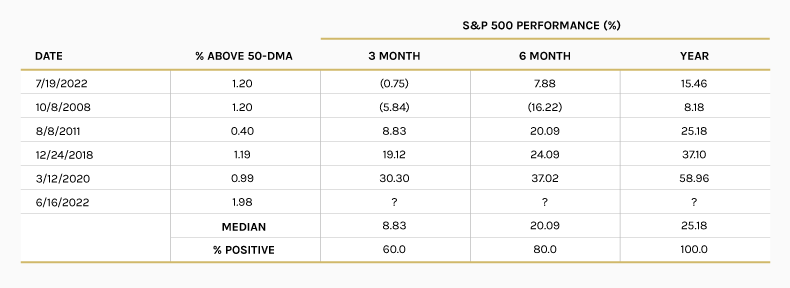
    1. By June 16th, the S&P 500 had faced a thorough washout. On that day, less than 2% of stocks were trading above their 50-day moving averages. Such extreme readings are quite bullish and reflect some level of maximum pessimism. In fact, Chart 2 shows the past occurrences since 1990 of similar sub-2% readings with their corresponding future returns.
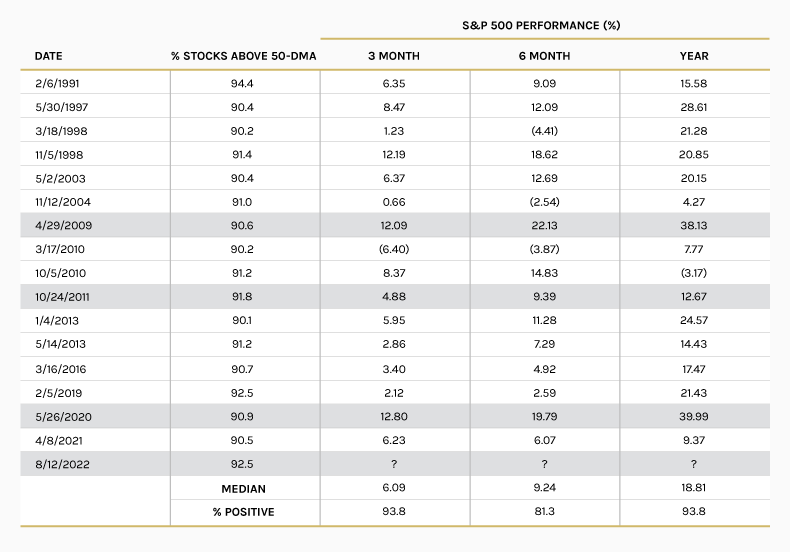
    2. Fast forward to August 14th and over 90% of the S&P 500 stocks traded above their 50-day moving average. Wow, what a turnaround!

Chart 2
10271006-Chart-2.png

Source: Bespoke August 12, 2022

Chart 3 shows the returns for the S&P 500 (since 1990) with a similar kind of broad rally.

Chart 3
10271006-Chart-3.png

Source: Bespoke August 16, 2022.

  1. However, it’s not only the magnitude and breadth of the rally that is flashing a far more optimistic tone. Market leadership has shifted dramatically, and this is a very bullish sign.

Consider:

In the first half of the year, the best performing sectors relative to the S&P 500 (down -19.97% as of June 30) were energy (+51.39%), utilities (+19.37%), staples (+14.69%) and health care (+11.65%). The worst performing sectors were consumer discretionary (-12.53%) and technology (-6.60%).2

Makes total sense to me:

Energy and utility stocks have done well as inflation rises and demand continues. But as growth contracts, stocks that are sensitive to the health of the economy lose favor and defensives perform better. These include stocks of companies that produce items such as toothpaste, electricity, and prescription drugs.3

However, since the end of the second quarter, there has been a complete market leadership change. The best performing sectors relative to the S&P 500 (up +13.44% as of August 18) are consumer discretionary (+11.09%) and technology (+5.46%). Meanwhile the worst performing sectors are health care (-10.21%), consumer staples (-6.93%) and energy (-2.87%).2

Since 1962, stocks have delivered their highest performance during the early cycle, returning on average 20% per year during this phase. Consumer discretionary stocks have beaten the broader market in every early cycle since 1962.3

While it’s not surprising to see some weakness after such a strong move into overbought territory, could Mr. Market be sending a signal that we are at the beginning of a new bull market?

Or is this just a bear market rally head fake?

I guess it depends on whose corner you are in.

1 Bloomberg as of August 18, 2022.
2 As measured by XLE, XLU, XLP, XLV, XLY and XLK. Bloomberg.
3 Fidelity. How To Invest In A Business Cycle. August 12, 2022.


RISK CONSIDERATIONS

There is no assurance that a portfolio will achieve its investment objective. Portfolios are subject to market risk, which is the possibility that the market values of securities owned by the portfolio will decline and may therefore be less than what you paid for them. Market values can change daily due to economic and other events (e.g. Natural disasters, health crises, terrorism, conflicts and social unrest) that affect markets, countries, companies or governments. It is difficult to predict the timing, duration, and potential adverse effects (e.g. Portfolio liquidity) of events. Accordingly, you can lose money investing in this portfolio. Please be aware that this portfolio may be subject to certain additional risks. In general, equities securities’ values also fluctuate in response to activities specific to a company. Stocks of small-and medium-capitalization companies entail special risks, such as limited product lines, markets and financial resources, and greater market volatility than securities of larger, more established companies. Investments in foreign markets entail special risks such as currency, political, economic, market and liquidity risks. Illiquid securities may be more difficult to sell and value than publicly traded securities (liquidity risk). Non-diversified portfolios often invest in a more limited number of issuers. As such, changes in the financial condition or market value of a single issuer may cause greater volatility.

INDEX DEFINITIONS

The indexes are unmanaged and do not include any expenses, fees or sales charges. It is not possible to invest directly in an index. Any index referred to herein is the intellectual property (including registered trademarks) of the applicable licensor. Any product based on an index is in no way sponsored, endorsed, sold or promoted by the applicable licensor and it shall not have any liability with respect thereto. The S&P 500® Index measures performance of the large cap segment of the U.S. equities market, covering approximately 75% of the U.S. market, including 500 leading companies in the U.S. economy.

IMPORTANT INFORMATION

There is no guarantee that any investment strategy will work under all market conditions, and each investor should evaluate their ability to invest for the long-term, especially during periods of downturn in the market.

A separately managed account may not be appropriate for all investors. Separate accounts managed according to the particular Strategy may include securities that may not necessarily track the performance of a particular index. Please consider the investment objectives, risks and fees of the Strategy carefully before investing. A minimum asset level is required.

For important information about the investment managers, please refer to Form ADV Part 2.

The views and opinions and/or analysis expressed are those of the author or the investment team as of the date of preparation of this material and are subject to change at any time without notice due to market or economic conditions and may not necessarily come to pass. Furthermore, the views will not be updated or otherwise revised to reflect information that subsequently becomes available or circumstances existing, or changes occurring, after the date of publication. The views expressed do not reflect the opinions of all investment personnel at Morgan Stanley Investment Management (MSIM) and its subsidiaries and affiliates (collectively “the Firm”), and may not be reflected in all the strategies and products that the Firm offers.

Forecasts and/or estimates provided herein are subject to change and may not actually come to pass. Information regarding expected market returns and market outlooks is based on the research, analysis and opinions of the authors or the investment team. These conclusions are speculative in nature, may not come to pass and are not intended to predict the future performance of any specific strategy or product the Firm offers. Future results may differ significantly depending on factors such as changes in securities or financial markets or general economic conditions.

This material has been prepared on the basis of publicly available information, internally developed data and other third-party sources believed to be reliable. However, no assurances are provided regarding the reliability of such information and the Firm has not sought to independently verify information taken from public and third-party sources.

This material is a general communication, which is not impartial and all information provided has been prepared solely for informational and educational purposes and does not constitute an offer or a recommendation to buy or sell any particular security or to adopt any specific investment strategy. The information herein has not been based on a consideration of any individual investor circumstances and is not investment advice, nor should it be construed in any way as tax, accounting, legal or regulatory advice. To that end, investors should seek independent legal and financial advice, including advice as to tax consequences, before making any investment decision.

Charts and graphs provided herein are for illustrative purposes only. Past performance is no guarantee of future results.

The indexes are unmanaged and do not include any expenses, fees or sales charges. It is not possible to invest directly in an index. Any index referred to herein is the intellectual property (including registered trademarks) of the applicable licensor. Any product based on an index is in no way sponsored, endorsed, sold or promoted by the applicable licensor and it shall not have any liability with respect thereto.

This material is not a product of Morgan Stanley’s Research Department and should not be regarded as a research material or a recommendation.

The Firm has not authorised financial intermediaries to use and to distribute this material, unless such use and distribution is made in accordance with applicable law and regulation. Additionally, financial intermediaries are required to satisfy themselves that the information in this material is appropriate for any person to whom they provide this material in view of that person’s circumstances and purpose. The Firm shall not be liable for, and accepts no liability for, the use or misuse of this material by any such financial intermediary.

This material may be translated into other languages. Where such a translation is made this English version remains definitive. If there are any discrepancies between the English version and any version of this material in another language, the English version shall prevail.

The whole or any part of this material may not be directly or indirectly reproduced, copied, modified, used to create a derivative work, performed, displayed, published, posted, licensed, framed, distributed or transmitted or any of its contents disclosed to third parties without the Firm’s express written consent. This material may not be linked to unless such hyperlink is for personal and non-commercial use. All information contained herein is proprietary and is protected under copyright and other applicable law.

Eaton Vance is part of Morgan Stanley Investment Management. Morgan Stanley Investment Management is the asset management division of Morgan Stanley.

Diesen Beitrag teilen: