


Janus Henderson: Is the liquidity backdrop for markets now negative?
The consensus narrative is that recent equity market declines reflect worries that rising inflation will force central banks to accelerate policy tightening. An alternative possibility is that global monetary conditions are already restrictive and will act as a drag on the economy and markets even if policies are unchanged.
14.02.2018 | 09:19 Uhr
 Market prospects, on the view here, are related to the difference – if any – between actual growth in the stock of money and the rate of expansion warranted by (nominal) economic expansion. “Excess” money growth will usually be associated with an increase in demand for financial assets and higher prices of those assets (assuming unchanged supply). Conversely, low money growth relative to economic needs will usually signal weak demand for assets and stagnant or falling markets.
Divergences between actual and required money growth may be reflected in a general trend in asset prices or a sharp movement in a particular market, depending on the economic backdrop, popular investment themes and valuations, among other factors.
The level of money growth required to support economic expansion, of course, cannot be measured directly. A simple approach is to assume that the economic demand for money rises in line with output and prices of goods and services. The sign of the gap between money growth and the sum of output growth and inflation will then be a gauge of whether monetary conditions are positive or negative for asset prices.
Such an approach would have been helpful for assessing global equity market prospects historically. We examined the relationship between the monthly excess return on the MSCI World index in US dollars relative to US dollar cash and the sign of the gap between the six-month rates of change of G7 real narrow money (using consumer prices as the deflator) and industrial output. The mean excess return on equities over cash between December 1969 and December 2017 (48 years) was 3.6% per annum (pa). The mean excess return in months following a positive signal from the real money / output growth gap was 10.2% pa*. By contrast, equities suffered a mean net loss of 4.8% pa in months following a negative signal.
The chart compares the cumulative return relative to US dollar cash of the MSCI World index and a strategy that switches between equities and cash depending on the sign of the real money / output growth gap**. The strategy would have captured much of the rise in equities while limiting drawdowns***.
The gap between G7 six-month real narrow money growth and industrial output growth was positive between January 2011 and November 2017 but appears to have fallen below zero in December, based on full monetary / price data and partial information on industrial output.
Incorporating China and other large emerging economies does not alter the current signal: G7 plus emerging E7 six-month real narrow money growth also appears to have crossed beneath industrial output growth in December.
Real broad money growth – either G7 or G7 plus E7 – is also now below industrial output growth.
A cautious investment stance may remain warranted until the real money growth / output growth gap reverses back into positive territory.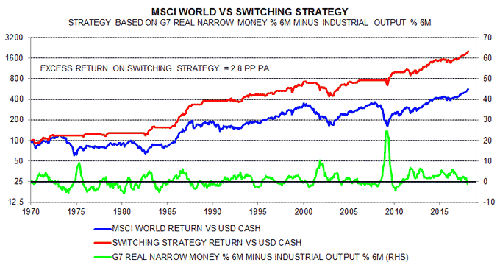
*The analysis allowed for a two-month reporting lag for monetary / economic data.
**The strategy also requires the six-month change in real narrow money to be positive in order to hold equities.
***The strategy suffered a significant loss during the 2000-02 bear market because it switched back into equities prematurely. Equity market valuations were still historically high when the buy signal was issued.
Diesen Beitrag teilen: