Janus Henderson: Global economic prospects still dimming
The baseline view here is that the current global economic downswing will extend into the first half of 2019, and probably beyond mid-year. Incoming news is consistent with this scenario, so Somon Ward, economist at Janus Henderson.
11.12.2018 | 12:55 Uhr
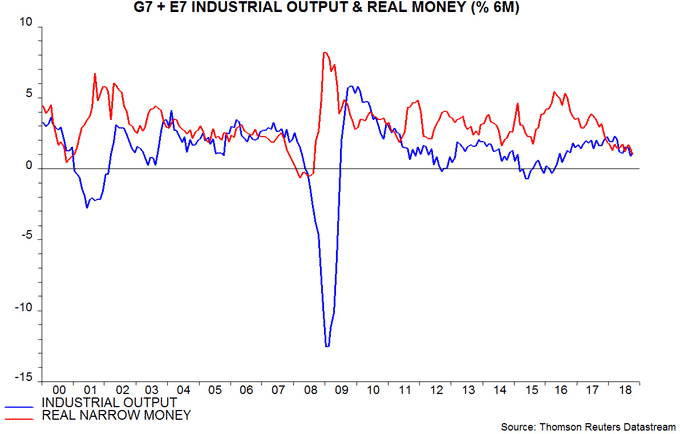
Near-complete monetary data for October confirm that G7 plus emerging E7 real narrow money growth fell to a new low – see first chart. This suggests that six-month industrial output momentum is unlikely to reach a trough until around July 2019 at the earliest, based on the historical average nine-month lead time at turning points.

As an aside, G7 plus E7 real narrow money growth may have crossed back below industrial output growth in October, with partial data indicating a rebound in the latter – an October estimate is included in the chart. If confirmed, the first of the two equities / cash switching rules described in a previous post will move from equities to cash at end-December*.
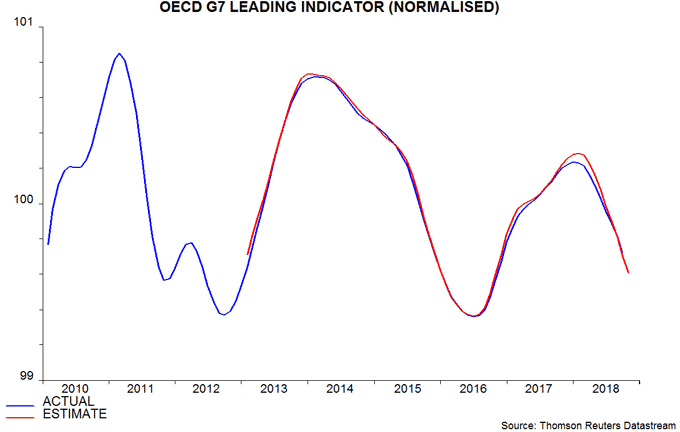
Non-monetary leading indicators are signalling a near-term further economic slowdown. The OECD will release October data for its composite leading indicators on 10 December but most of the component information is already available, allowing an independent calculation. The G7 indicator is estimated to have fallen further in October, reflecting declines in all countries bar Japan (where weather-related disruption to activity and a subsequent recovery may have distorted recent readings) – second chart**. The indicators are designed to predict the direction of detrended GDP, i.e. a decline signals below-trend growth.

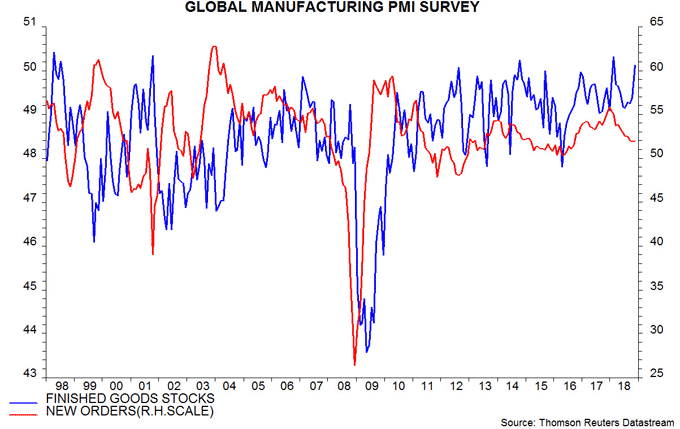
Previous posts argued that a downswing in the global stockbuilding cycle would act as a drag on growth in late 2018 and 2019. The cycle has averaged about 3.5 years, measured from trough to trough, and the last low is judged to have occurred in early 2016, implying that the next one could be reached in the second half of 2019. Global manufacturing PMI survey results for November support the view that the cycle is at or past a peak, with the finished goods stocks index close to the series high and diverging from weak new orders – third chart.

Stockbuilding cycle downswings in 2011-12 and 2015-16 were associated with significant global economic slowdowns. The current downswing may coincide next year with a downswing in the longer-term business investment cycle, which last troughed in 2009 and is scheduled to reach another low by 2020 at the latest. The risk of the current economic slowdown developing into a recession, in other words, is greater than in 2012 and 2016.
Global narrow money trends would need to weaken further for a recession to be adopted as the central case here. The six-month change in G7 plus E7 real narrow money turned negative ahead of the 2008-09 recession – first chart. It fell to 0.4% (not annualised) ahead of the milder 2001 recession. The October reading was 1.0%. A reasonable judgement is that a recession call would be warranted by a further fall to 0.5%.
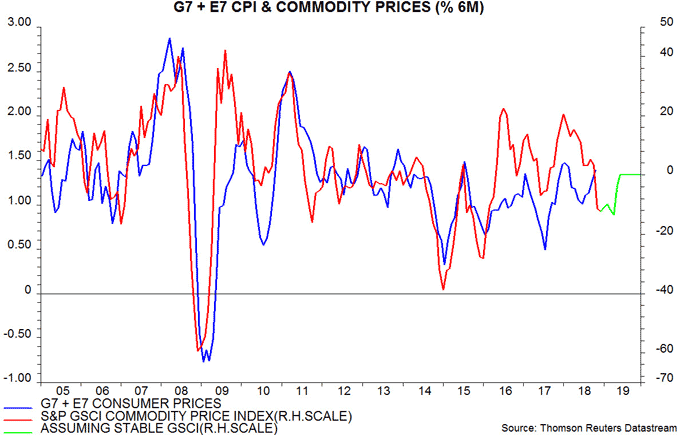
As previously discussed, the recent collapse in the oil price will provide near-term support to real money growth by cutting headline inflation. The six-month change in G7 plus E7 consumer prices could fall by about 0.5 of a percentage point if commodity prices, as measured by the energy-heavy GSCI, are stable at current levels – fourth chart. Six-month nominal narrow money expansion, therefore, might need to fall by a further 1 percentage point to push real growth down to 0.5%.

*The second rule, based on whether G7 annual real narrow money is above or below 3%, remains in cash currently. Its recommendation at end-December will depend on November monetary / inflation data to be released over the course of this month. Both rules were in cash during October.
**Of the G7 country indicators, only Canada’s includes a monetary aggregate.


Diesen Beitrag teilen: