


Janus Henderson: US inventory cycle turning positive
Expectation of a significant contribution from the inventory cycle rise.
23.08.2017 | 07:15 Uhr

(Foto: Simon Ward)
The Kitchin inventory cycle usually plays out over three to five years, with upswings lasting at least 18 months. Cycle lows are judged here to have occurred in 2009, 2012 and 2016.
Upswings follow a three-step pattern*, involving an initial burst of strength (A) followed by a pull-back (B) and final surge (C) into the cycle top.
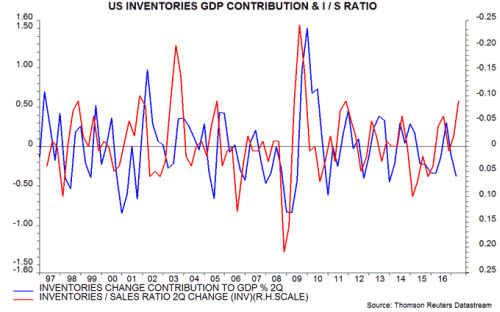
The blue line in the chart shows the contribution of the change in inventories to two-quarter GDP growth. The contribution was negative for five quarters ending in the third quarter of 2016, consistent with a cycle low having been reached in 2016.
The growth contribution was positive in late 2016 but turned negative again in the first half of 2017. Steps A and B of the upswing, therefore, may have been completed, with the C boost scheduled to begin.
This interpretation is supported by an analysis of the inventories to sales ratio. The red line in the chart shows the two-quarter change in the ratio, plotted inverted. A rise in the ratio is usually followed by firms cutting the rate of increase or level of inventories, resulting in a negative growth contribution (and vice versa). The ratio fell sharply during the first half of 2017, suggesting that firms were surprised positively by final sales and supporting the expectation of significant restocking over the next several quarters.
*See Tony Plummer, Forecasting Financial Markets.
Diesen Beitrag teilen: