Janus Henderson Investors: OECD leading indicators - fade the pick-up
The OECD’s leading indicators continued to recover in December but the signal should be discounted.
11.02.2020 | 14:47 Uhr
The recent pick-up is consistent with a rise in global real narrow money growth into September but a subsequent monetary relapse suggested that that the indicators would lose momentum from early 2020. The coronavirus shock will advance and magnify weakness.
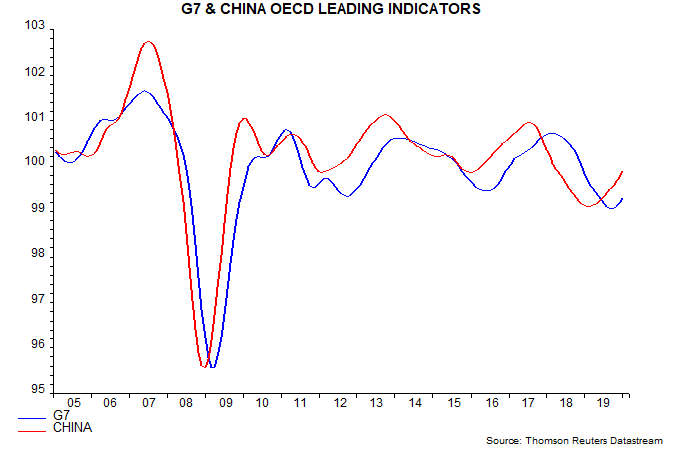
The OECD presents its leading indicators in ratio-to-trend form, i.e. a rise (fall) indicates future economic growth above (below) trend. The G7 indicator rose for a third month in December while the Chinese indicator has been increasing (prematurely) since early 2019 – see first chart.

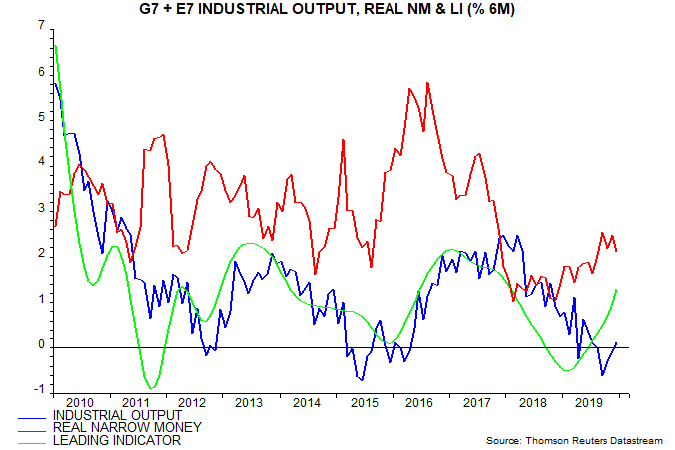
The approach here is to generate a “global” leading indicator of the level of output by combining the OECD data for the G7 and seven large emerging economies and “adding back” trend growth. The second chart compares the six-month rate of change of this indicator with rates of change of industrial output and real narrow money.

Rate of change turning points in the leading indicator have led those in industrial output by four to five months on average compared with a nine-month lead for real narrow money. Real money, therefore, typically leads the leading indicator by four to five months.
Real money growth rose from a low in November 2018 to a high in September 2019, falling back into December. This suggested that leading indicator momentum would bottom in March-April 2019 and rise through January-February 2020, relapsing into Q2. The low occurred slightly earlier than expected in February 2019, i.e. the real money lead on the leading indicator was three months on this occasion.
The next set of OECD leading indicator data, for January, will incorporate February business survey results, which are likely to be hit hard by the coronavirus shock. The six-month change in the global indicator, incorporating revisions, may turn out to have peaked in December or January.
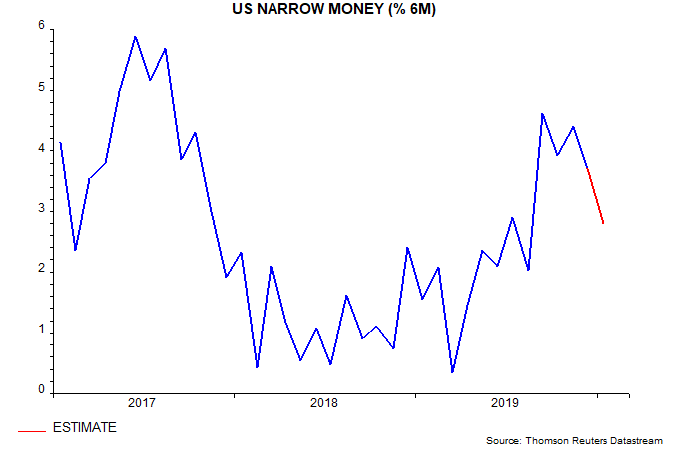
A preliminary estimate of global real narrow money growth in January will be available later this week. Early indications are unfavourable: weekly US narrow money data through 27 January suggest a further fall in six-month growth – third chart – while the inflation drag on Chinese real money increased as food prices continued to surge.


Diesen Beitrag teilen: