


Schroders: One year of President Trump
In the 12 months since Donald Trump was elected US president, stockmarkets have hit record highs. Will the rally continue?
09.11.2017 | 12:38 Uhr
President Trump has credited himself for the rise in the stockmarket since he won the US election 12 months ago.
It is not fake news. Demand for equities has been strong because it is hoped the Trump administration will pass legislation reducing tax for companies, which should boost their profitability.
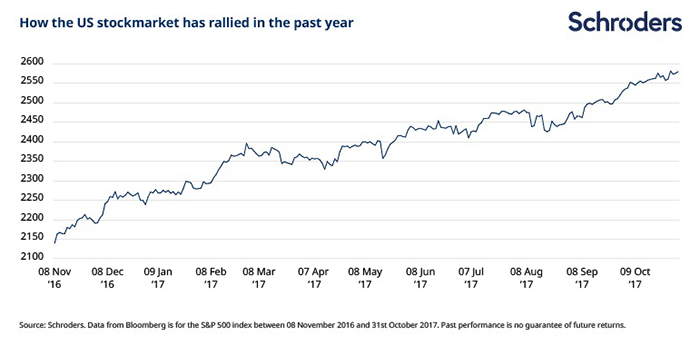
Since the election on 9 November 2016 US stocks have risen by 22.1%. The S&P 500’s most recent all-time high of 2,581.07 was set on 27 October 2017.
It’s not just US stocks that have been buoyed. Global stocks are up 21.2% in the past year, as measured by the MSCI World index, and at all-time highs too.
It should be noted that markets are in the midst of a bull run that is in its ninth year. The S&P 500 is up 281% since its March 2009 low, equating to average annual rise of around 18%.
Stocks have recovered from the global financial crisis and continue to benefit from loose central bank monetary policy and low interest rates.
Markets rose fastest immediately after the election with investors buying into the “Trump trade” – the hope of tax cuts and policies that would boost spending, such as on infrastructure, and create inflationary pressure, which can make equities more attractive.
Trumps pro-business proposals included:
- Lower corporate taxes
- A repatriation tax holiday - a tax break on overseas profits
- Massive infrastructure spending
- Financial deregulation
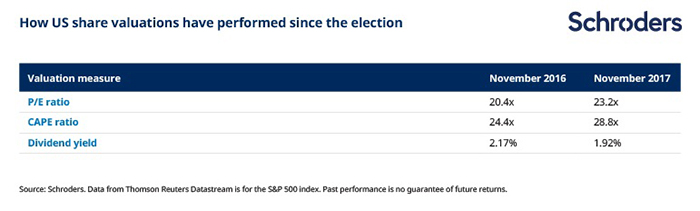
As a result of this rally, and company profits not rising fast enough to keep up, the stockmarket has become expensive.
The table below covers the most common ways to value equities.
- A P/E ratio compares share prices with earnings, with a lower number suggesting better value.
- CAPE or cyclically-adjusted price-to-earnings ratio, works similarly but is averaged over a decade to smooth out distortions of economic cycles.
- The dividend yield, the average income paid by S&P 500 companies, also offers some guidance to valuation
What has happened to bonds?
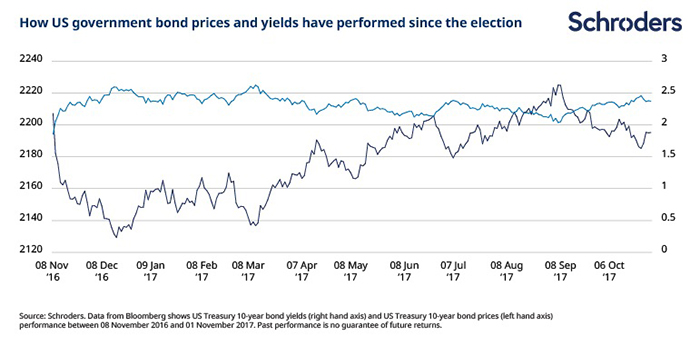
The prices for US government bonds, or Treasuries, have fallen sharply in the past year.
This is for similar reasons for the strong performance of shares – because of the anticipated inflationary spending from the Trump administration.
Inflation is bad for bonds, making the fixed income they pay today less attractive when income available elsewhere may be rising.
As the chart below shows, bond prices and yields have an inverse relationship. So, while bond prices have been falling (the dark blue line on the chart), down by 0.55% in the past year for 10-year Treasuries, the yield (the light blue line on the chart) has risen from 1.85% to 2.37%.
Another factor has been rising rates. The Federal Reserve has increased rates from 0.5% to 1.25% with markets anticipating further increases. This has a similar effect of driving down bond prices and pushing up yields.
What next?
Trump has found it difficult to pass his pre-election proposals through Congress and into law, raising a question mark about the recent rally in stocks.
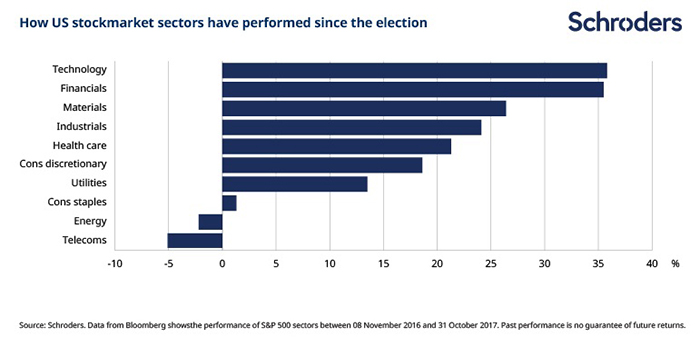
Stocks in the financial sector, such as banks and insurers, would benefit most from the proposed financial deregulation. They have risen 35.5% in the last 12 months.
Shares in the industrial sector, which includes construction firms, are up by 24.1%; the materials sector, which includes miners who produce raw materials used in construction, have risen by 26.4%.
So, if Trump is struggling to turn proposals into policy why are stockmarkets still rising and can it last?
Matt Ward, US Equities Fund Manager, said:
“While presidents may be credited with the direction of a stockmarket, it is the underlying economy that dictates how equities will perform.
“The US economy continues to show signs of sustained, underlying strength. In particular the consumer, which represents roughly 70% of the US economy, has been buoyed by durable jobs growth, an uptick in wage growth and rising home prices and equity markets. Even the industrial economy, which was a point of consternation as recently as early last year, is showing signs of sustainable growth.
“Accordingly, corporate earnings have improved: more companies beat earnings expectations in the second quarter of 2017 than in any other quarter since 2010. We anticipate this trend to continue to the end of 2017.
“However, that doesn’t make it an obvious choice for investors. The stockmarket valuation is historically high. Currently, CAPE is at 28.8 vs 24.2 historically, but we feel that is partly justified by the pace of earnings growth.
“As a result, we prefer areas of the market such as technology and consumer discretionary, where there are strong long-term growth trends. We are cautious with expensive sectors, such as consumer staples and utilities, which have been bid up by the easy money of quantitative easing.
“While the market is expecting some form of tax reform coupled with less regulation, we are still a far cry from the post-election euphoria evident in the so-called ‘Trump Trade’ of late last year.
“Even the most aggressive policy assumptions add only 30 basis points to our annual 2.5-3.0% GDP outlook – hardly enough to drive momentous sector rotation or lead to an economy so overheated that the Fed must intervene.”
Die hierin geäußerten Ansichten und Meinungen stellen nicht notwendigerweise die in anderen Mitteilungen, Strategien oder Fonds von Schroders oder anderen Marktteilnehmern ausgedrückten oder aufgeführten Ansichten dar. Der Beitrag wurde am 09.11.17 auch auf schroders.com veröffentlicht.
Diesen Beitrag teilen: