Morgan Stanley IM: CAPEX Reshapes Credit Profile: Sectors in Flux
Despite macro uncertainties, global capital spending continues to surge after a period of short-lived contraction in 2020, powering the post-pandemic economic recovery. The Investment Grade Credit team explains how this might impact market sectors.
04.08.2022 | 07:08 Uhr
Here you can find the complete article.
Despite macro uncertainties, global capital spending continues to surge after a period of short-lived contraction in 2020, powering the post-pandemic economic recovery.
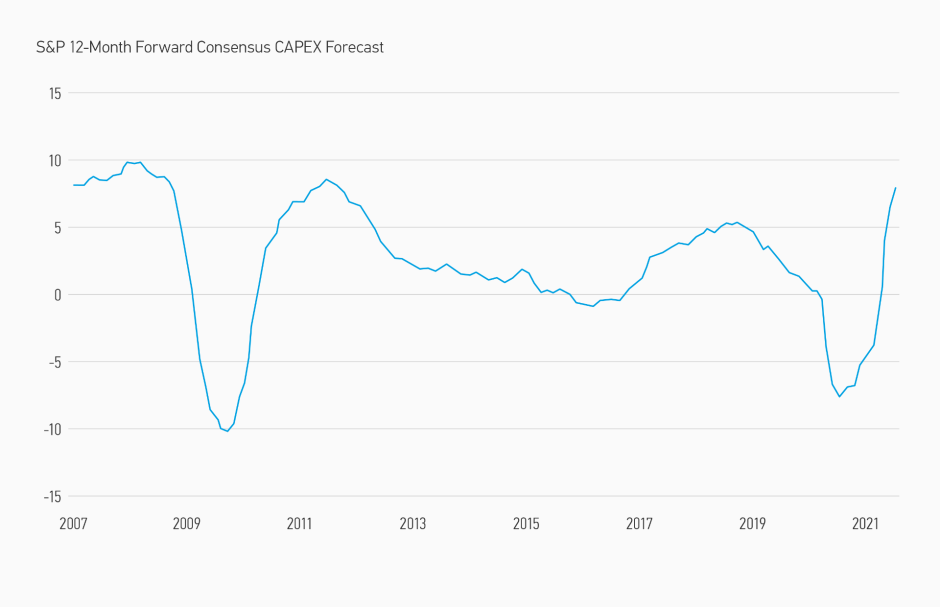
We expect U.S. Investment Grade Corporate CAPEX to increase +15% in 2022, maintaining the +14% year-over-year (YoY) momentum in 2021 (Display 1). Its impact on fundamental credit profile flows through all three financial statements: CAPEX is a key determinant of cash flow, of multi-year leverage trajectory and debt supply, as well as of future revenue and margins through capturing demand and increasing productivity over time.
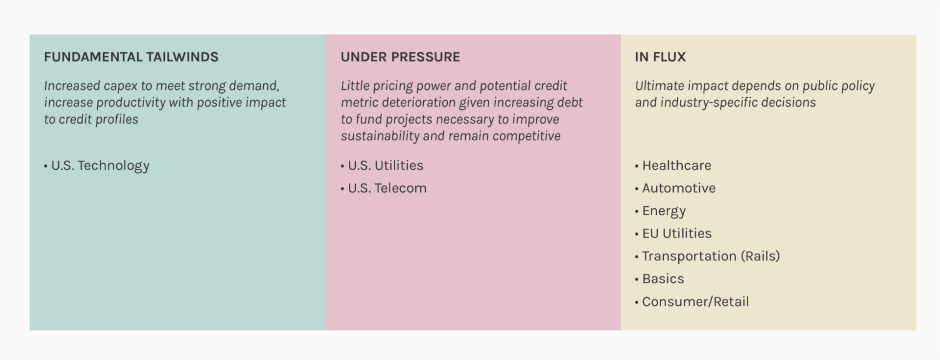
We view U.S. Technology as a clear winner, while U.S. Utilities and U.S. Telecom emerge as sectors most under pressure (Display 2).
DISPLAY 1
Global CAPEX Is on the Rise

Source: S&P Global CAPEX Survey 2021. Forecasts/estimates are based on current market conditions, subject to change, and may not necessarily come to pass.
DISPLAY 2
CAPEX Is Impacting Different Sectors in Different Ways

For informational purposes only and does not constitute an offer or a recommendation to buy or sell any particular security or to adopt any specific investment strategy.
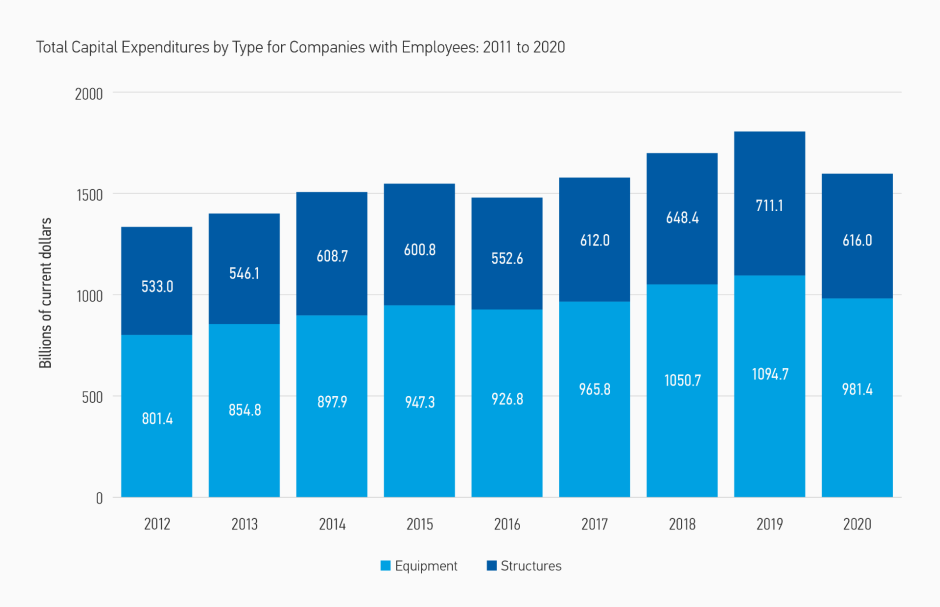
According to the U.S. Census Bureau 2022 Capital Spending Report (Display 3), from 2011 to 2020 U.S. non-farm businesses increased total spending from $1,243.0 billion to $1,706.4 billion, an increase of $463.5 billion (+37.3%). The increase was led by Utilities (+85.8% or $84.2bn), partially offset by the largest decrease in the Mining sector (-41.4% or $68.6bn). Underlying this trend are three driving factors: Sustainability, Supply chain, and Security.
The Three Reasons CAPEX Is Rising: Sustainability, Supply Chain, Security
The broader transition to a more sustainable global economy drives higher CAPEX across industries in order to reduce
carbon emissions, protect water supply and improve the environmental
and social impact of supply chains over the long term. Key themes
include electric vehicles (EV), utility grid upgrades, transition from
fossil fuels to renewables, and overall energy efficiency.
DISPLAY 3
U.S. Census 2022 Capital Spending Report

Source: U.S. Census Bureau 2022 Capital Spending Report
Government policies broadly incentivize and support corporate Environmental, Social and Governance (ESG) initiatives. The ongoing Assessment Reports of the Paris Agreement and Intergovernmental Panel on Climate Change (IPCC) helped to consolidate international support and increase corporate commitments to net zero carbon emissions, with Europe leading the way. Specifically, Europe’s “Fit for 55” package and other efforts have provided tailwinds for green CAPEX by providing command and control mechanisms such as fuel blending mandates, offering clarity in defining sustainable activities (EU Taxonomy), and adopting market-based approaches to implement carbon initiatives, which include carbon markets and border adjustment mechanisms for carbon intensive sectors such as steel, cement, aluminum, and fertilizers.
Estimates on economy-wide investment requirements have an understandable spread, although they clearly exceed current capital expenditures. By 2030, annual global investment requirements to meet net zero goals are anticipated to $4 - $5.7 trillion per year in clean energy and energy infrastructure alone,1 at least three times current levels. Recent research from McKinsey suggests that using the hypothetical Net Zero 2050 scenario from the Network for Greening the Financial System, annual overall green investments needed to stay on track for net zero between now and 2050 are $9.2 trillion ($275 trillion total).
While we may reflexively think of government compelled “green” capital investment as detrimental to corporate balance sheets, the European Union has put in place several mechanisms to protect European corporations from competition by taxing less-sustainable imports. The time bound, science-based goals create immediate investment pressure on both public and private sectors, particularly as the importance of achieving 2030 interim targets becomes increasingly clear. Therefore, we view Europe as a potential bellwether for the U.S. and expect to see even higher green CAPEX levels globally.
Global supply chain is another hot topic—strained in normal times and stressed repeatedly in recent years for a variety of reasons—and U.S. corporates are diversifying manufacturing capabilities in response. They are also increasing efficiency and automation, bolstering productivity to address labor shortages and tight inventories.
Labor inflation is a key leading indicator for manufacturing CAPEX. Under current conditions, we expect to see a cycle of elevated spending to improve profitability. Companies look to automate wherever possible in order to compensate for low labor levels and high wages, however these investments are initiated in sectors where demand outstrips supply and strong cash flows can fund the spending.
In the theme of de-globalization, many industries are onshoring manufacturing capabilities to address shipping bottlenecks in the near-term and increase diversification longer-term. Companies in the Machinery, Electrical and Transportation equipment sectors are seeking to re-shore to reduce lead time and increase flexibility, whilst companies in the Aerospace, Communication, Automotive, Semiconductors, Chemicals, Medical products, Pharma sectors list national security and supply security as the top reason. This trend is broadly aligned with the U.S.’s sustainability goals and the broader economic agenda to boost domestic GDP and create jobs post pandemic.
Geopolitical security has taken on heightened importance in 2022 given the ongoing Russian/Ukraine conflict in Europe. Where it intersects with Sustainability and Supply Chain, we see CAPEX dedicated to address all these concerns take priority. Namely in Agriculture and Energy sectors, along with the push for decarbonization, we see initiatives aimed at bolstering the aggregate level of supply and diversifying away from certain regions. For example, there are discussions for the U.S. and EU to boost supplies of liquefied natural gas (LNG) in European countries by the end of 2022, which would help reduce reliance on Russian gas and incentivize greater LNG diversification. The REPowerEU plan would not only cut Russian gas imports, but also call for an accelerated integration of wind and solar, biomethane production, and heat pump addition. The goal of these plans, in collaboration with international partners, is to chart an alternative path for Europe’s energy security since Russian gas currently accounts for about 40% of total supply.
SECTORS WITH STRONG TAILWINDS: Limited rating migration net of new supply. Benefits from strong government support and increased financial flexibility. We believe current CAPEX investments will directly accrue to higher productivity, better margins and drive future demand with limited impact on credit profile.
- The U.S. IG Technology sector is experiencing exceptionally
strong underlying demand, as the pandemic both accelerated digital
transformation and boosted consumer savings in the U.S.
U.S. IG Technology issuers expect higher free cash flow across the board while ramping up investments to meet backlog and manage supply chain disruptions. For the IG Tech sector in particular, CAPEX spend can directly boost productivity, increases margins, and enables firms to gain greater scale. This tailwind has lifted a crop of rising stars from the BB rating category to BBB in 2021, and we expect the trend to continue.
In particular, supply chain disruptions amidst this exceptionally strong demand backdrop have driven semiconductor companies to increase capital spending by $200bn+ over the next decade in the U.S. and Europe in order to secure supply. While we do expect continued debt supply from the high-rated names in the space to partly fund higher CAPEX, the impact on credit profiles and current ratings should be de minimis. Companies in the space have accumulated large cash balances, significant financial flexibility through asset sale, spin, or IPO transactions, and could expect incremental government support in boosting domestic semiconductor manufacturing capabilities. Overall, we expect improved credit profiles and more rising stars as strong demand creates opportunity for increased scale.
SECTORS UNDER PRESSURE: Deterioration in credit profile net of new
supply. Incremental CAPEX is a “tax” on free cashflow (FCF) and leverage
profile driven by regulation and/or market dynamics. Higher leverage
occurs without commensurate growth in future demand and profitability.
- U.S. Utilities – Over the past decade, U.S. electric
utilities have intensified their capital spending, i) to reduce carbon
pollution, ii) to update and replace aging infrastructure, iii) to
harden systems and protect against more volatile weather and, iv) to pay
for smart grid technology, increased security to safeguard against
physical and cyber-attacks. Regulated Utilities’ prudent capital
investments can have a positive impact on their Return on Equity (ROE),
as it increases their underlying rate-base. In the near-term credit
metrics can be negatively impacted as CAPEX is largely debt financed and
with some lag expected before cash flow begins.
- U.S. Telecoms – Despite heavy spending on 5G wireless spectrum and CAPEX, these investments do not necessarily lead to greater pricing power or revenues. Rather, carriers are forced to make these investments in order to not fall behind in network performance and guard their respective wireless market shares. New 5G use cases are preliminarily being contemplated (i.e. – augmented reality, metaverse, internet-of-things, fixed-wireless broadband), but monetization and business models remain far from clear. While a key company predicts that the addressable market size of “network-as-a-service” will expand from $340 to $460 billion from 2021-26, CAPEX spending in Telecom is currently peaking and is expected to drop measurably in 2023, as major spectrum auctions generally occur every five years.
SECTORS IN FLUX: Rife with challenges and opportunities, with final
outcomes driven by public policy, level of government support, and
management teams’ choices in navigating the path forward.
We believe three sectors are particularly sensitive to the future course of public policy in their respective areas.
- Automobiles – Global Battery Electric Vehicle (BEV) CAPEX,
which represents ~50% of total Original Equipment Manufacturer (OEM)
R&D/CAPEX, is estimated to increase to $120 billion between 2020 and
2025. A large portion is currently funded by higher margin SUVs/ pickup
trucks on strong demand, and OEMs’ continued emphasis on these vehicles
over smaller/compact models. This in turn allows for the protection of
operating margins that are higher than pre-pandemic levels, a positive
for ratings profiles considering continued supply chain challenges and
in particular, chip shortages.
Over the past decade in the U.S., a variety of policies on the federal and local level have supported EV demand and helped companies scale manufacturing and battery capabilities. This was done through purchase subsidies and/or vehicle purchase and registration tax rebates, which aimed to help reduce the price gap with conventional vehicles. However, the U.S. still trails Europe & China in EV sales due to less stringent government mandates, differences in infrastructure investment, and consume preference.
As much as 38% of greenhouse gas emissions are caused by passenger cars.2 In order to meet stringent regulatory requirements as well as stay competitive, European automakers have increased spending on future technologies (e.g. electric car batteries and powertrain, digitalization). For example, one of the leading players is planning to spend at least 55% of its R&D and CAPEX budget on these technologies, ultimately reducing tailpipe emissions of its fleet as well as reducing carbon-intensity of its production plants. - Energy – After decades of structural underinvestment in
traditional energy sources, the sector now must contend with optimizing
CAPEX in an inflationary environment with increasing energy transition
mandates. Globally, oil-based fuel consumption now stands 3% above
pre-Covid levels.3 Europe’s pivot away from Russian natural gas supply
is also supportive of U.S. LNG development.
In this context, we are seeing 15-20% capital spending increases but only 0-5% production increases. The outliers are the supermajor integrated names which are raising their CAPEX budgets to around 30% growth as they pick-up spending on clean energy projects. - EU Utilities – European utilities continue to spend heavily
on the retirement of coal plants and the construction of more renewable
wind and solar generation. Coal and nuclear shutdowns have occurred
rapidly, offset by a sharp rise in power prices, driving the need for
replacement power, stability, and security of fuel imports. The
Russia/Ukraine conflict is accelerating sustainability programs in
Europe, with added urgency to a longer-term pivot away from Russian
natural gas supply and bolstering future energy security.
Thus far higher natural gas prices have been absorbed with subsidies from governments, passed on to consumers with tariff increases. In addition, the REPowerEU plan now calls for a two-thirds reduction in gas imports from Russia by winter 2022/23 through alternative supply sources, energy efficiency/savings, electrification, and filling storage to 90% by Oct. 1, 2022 (MS Equity Research).
Nuclear generation has been controversial: it is a core component for France but opposed by Germany. However, in order to accelerate transition, new construction for both nuclear and natural gas (on a temporary phase out basis) have been included in the EU taxonomy for new project spending.Another area of focus is the expansion of network grids. This includes greater regional interconnectedness, support for EV charging, and smart grids to improve efficiency for consumers.
- Pharma/Healthcare/Life Science & Diagnostics – The Covid pandemic was a key catalyst for increased manufacturing and R&D spending, where we see 50-100% increases among Life Sciences & Diagnostic companies compared to pre-Covid levels. Higher CAPEX alone has limited the impact on sector credit profiles, with rating trajectory and balance sheet capacity largely determined by M&A, and the outcome of U.S. drug pricing legislation.
SECTORS THAT HAVE HIGH MAINTENANCE CAPEX and could benefit from targeted, long-term solutions that address higher input costs in an inflationary environment.
- U.S. Transportation: Airlines have heavy CAPEX commitments
over the next few years as they focus on fleet renewal and right-size
capacity, taking delivery of newer, more fuel-efficient aircrafts which
would both lessen the impact of higher commodity prices and drive
environmental goals longer-term. Travel demand and input costs are
significant drivers for the sector. Trucking is moving towards automation to offset a tight labor environment, which requires large upfront costs. Rails are
mostly focused on keeping CAPEX at 15% of revenue or below given
continued focus to remove costs and improve profitability, though recent
productivity initiatives mainly seek to offset inflationary pressures.
- Environmental Services: Another CAPEX intensive sector with
an average spend at 12% of revenue expected for 2022, in-line with
historical averages. At least one notable company is directing
incremental investments in renewable natural gas capacity, as part of
its broader push for sustainability initiatives and improved investor
perception of the sector.
- Paper & Packaging: CAPEX guidance increased across the board for a core group of IG issuers in 2022, aimed to drive organic capacity growth in a tight supply environment, and automation of existing assets to manage labor supply shortages.
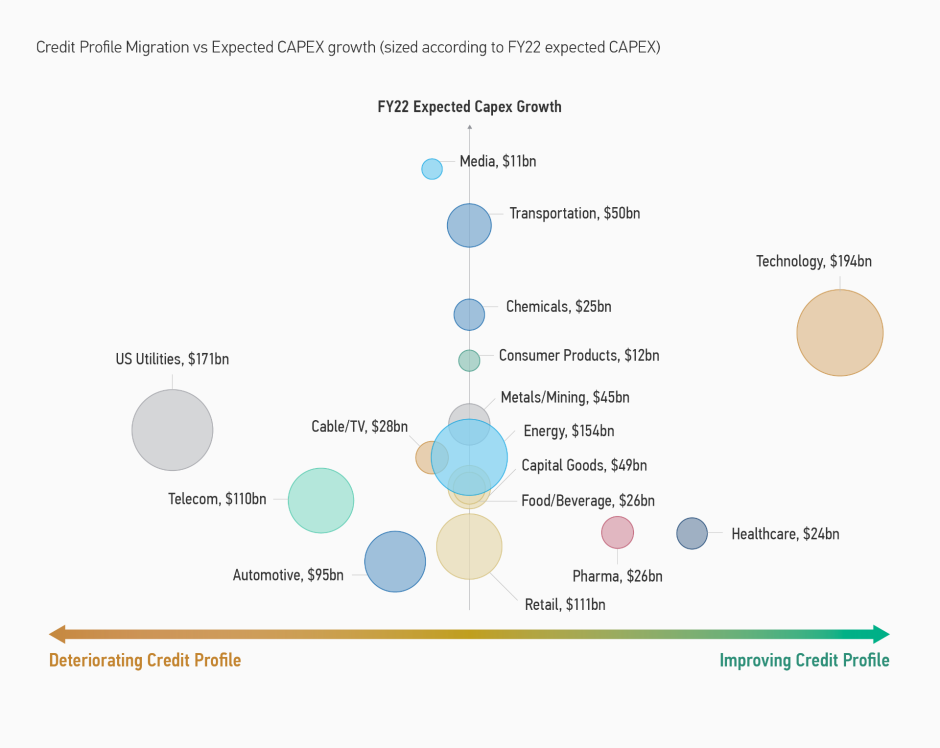
DISPLAY 4
CAPEX Summary: Credit Profile Winners and Losers

The fundamental impacts of CAPEX tell one piece of the story
When we think about investment allocations by sector, the effect of CAPEX on credit profiles is only one piece of the puzzle, one that must be tied to our fundamental views on valuation. The debate about where spreads are going and what is already priced in at current levels remains the key focus for credit investors. Given elevated CAPEX over a multi-year time frame, we could expect to see increasing debt supply which may push spreads wider.
We offer here a visualization of potential fundamental and technical drivers of spread changes resulting from CAPEX outlook. This is based on survey responses of MSIM Fixed Income research analysts on supply outlook and credit profile trajectory of issuers in our benchmark indices. Display 4 above illustrates the relationship between directional changes in credit profiles against expected CAPEX growth and size each sector on relative scale of future CAPEX.
Other contributors: ANGIE SALAM, Head of U.S. Non- Financial
Research; ELENA CIAMPICHETTI; Head of European Non- Financial Research;
PATRICK HOLT, Analyst, Research; JACKIE DESIR, Vice President, Research;
KERWIN BAILEY, Vice President, Research; MICHAEL DEICH, CFA, Executive
Director, Research; MATAS VALA, CFA, Vice President, Research; JEFFREY
CHIU, Analyst, Research RAYMOND SINGH, Executive Director, Research;
HENRY MASON, Senior Associate, Calvert JUN GOH, Associate, Calvert; SAM
RODGIER, Associate, Calvert
Risk Considerations
Diversification neither assures a profit nor guarantees against loss in a declining market.
There is no assurance that a portfolio will achieve its investment objective. Portfolios are subject to market risk, which is the possibility that the market values of securities owned by the portfolio will decline and that the value of portfolio shares may therefore be less than what you paid for them. Market values can change daily due to economic and other events (e.g. natural disasters, health crises, terrorism, conflicts and social unrest) that affect markets, countries, companies or governments. It is difficult to predict the timing, duration, and potential adverse effects (e.g. portfolio liquidity) of events. Accordingly, you can lose money investing in a portfolio. Fixed-income securities are subject to the ability of an issuer to make timely principal and interest payments (credit risk), changes in interest rates (interest rate risk), the creditworthiness of the issuer and general market liquidity (market risk). In a rising interest-rate environment, bond prices may fall and may result in periods of volatility and increased portfolio redemptions. In a declining interest-rate environment, the portfolio may generate less income. Longer-term securities may be more sensitive to interest rate changes. Certain U.S. government securities purchased by the strategy, such as those issued by Fannie Mae and Freddie Mac, are not backed by the full faith and credit of the U.S. It is possible that these issuers will not have the funds to meet their payment obligations in the future. Public bank loans are subject to liquidity risk and the credit risks of lower-rated securities. High-yield securities (junk bonds) are lower-rated securities that may have a higher degree of credit and liquidity risk. Sovereign debt securities are subject to default risk. Mortgage- and asset-backed securities are sensitive to early prepayment risk and a higher risk of default, and may be hard to value and difficult to sell (liquidity risk). They are also subject to credit, market and interest rate risks. The currency market is highly volatile. Prices in these markets are influenced by, among other things, changing supply and demand for a particular currency; trade; fiscal, money and domestic or foreign exchange control programs and policies; and changes in domestic and foreign interest rates. Investments in foreign markets entail special risks such as currency, political, economic and market risks. The risks of investing in emerging market countries are greater than the risks generally associated with foreign investments. Derivative instruments may disproportionately increase losses and have a significant impact on performance. They also may be subject to counterparty, liquidity, valuation, and correlation and market risks. Restricted and illiquid securities may be more difficult to sell and value than publicly traded securities (liquidity risk). Due to the possibility that prepayments will alter the cash flows on collateralized mortgage obligations (CMOs), it is not possible to determine in advance their final maturity date or average life. In addition, if the collateral securing the CMOs or any third-party guarantees are insufficient to make payments, the portfolio could sustain a loss.


Diesen Beitrag teilen: