Morgan Stanley IM: Oil – Unrestrained, Underappreciated and Underinvested
Despite growth in EV sales, oil demand has continued to increase over the past decade. With increased supply discipline and very attractive shareholder returns, we see a compelling outlook for oil prices and energy equities, Jitania Kandhari and Amol Rajesh of the Emerging Markets Equity Team explain.
23.11.2023 | 06:50 Uhr
This year, battery electric vehicle (BEV) purchases have been growing at nearly 40% and are on track to make up more than 10% of global auto sales. That is quite an achievement considering in 2012, BEV penetration comprised less than 1% of the market. Contrary to expectations, oil consumption has also steadily climbed. Oil demand in 2023 is up 10% from 2020 levels coinciding with the price climbing above $96 a barrel. Significantly, since 2012, oil usage has surged by an additional 10 million barrels. How do you account for this seemingly contradictory situation?
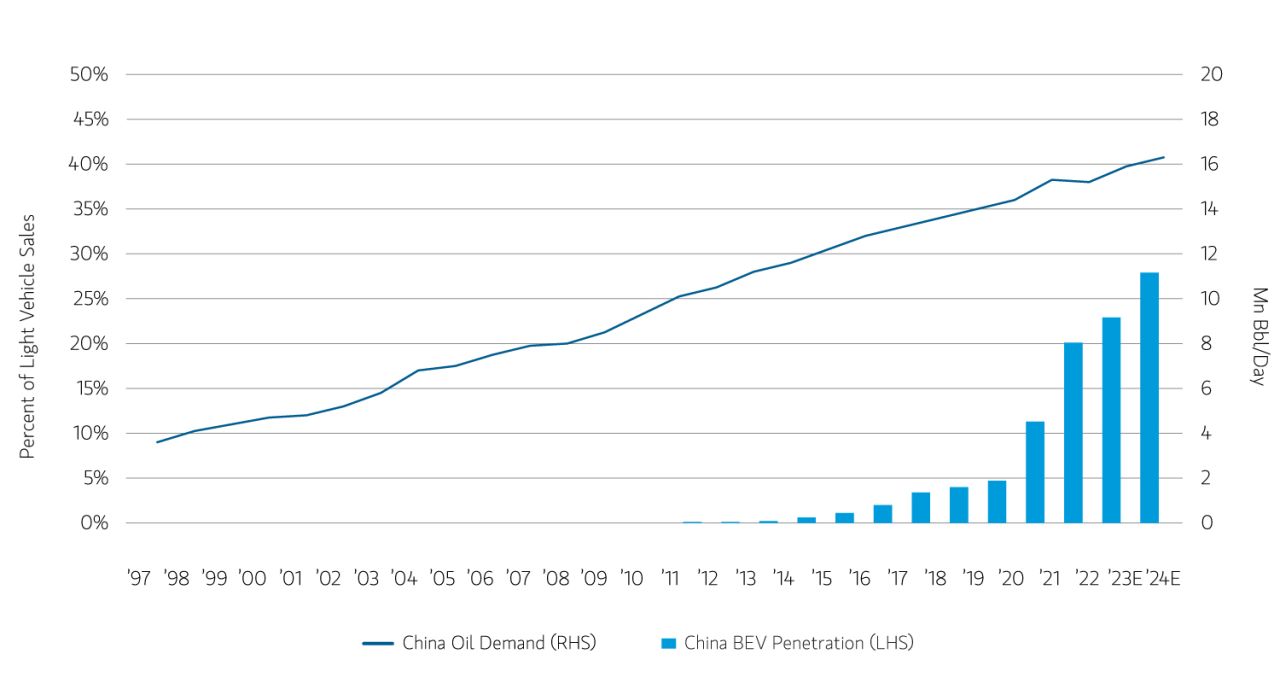
Despite widespread predictions of electric vehicles (EVs) displacing oil demand, their increasing adoption has not led to a significant reduction in oil consumption. Norway, which has the highest EV penetration globally, serves as an intriguing case study. Even as the share of EVs in new auto sales soared from 3% to 80% over a decade, Norway’s oil usage has not collapsed. In China, the largest EV market in the world, oil demand rose 50% as EV penetration went from less than 1% in 2012 to over 20% today.
Display 1 The More Things Change, the More They Stay the Same
Chinese oil demand has continued to increase despite rapid electric vehicle sales growth

What is often lost on commentators is that road transport accounts for less than half of global oil consumption. Jet fuel, petrochemicals and heating for industrial and residential users make up the other half. These other sectors have not experienced the same degree of disruption as road transport. According to the International Energy Agency (IEA), the petrochemical sector is projected to be the primary driving force behind global oil demand. Additionally, jet fuel should continue to grow as airline travel returns to pre-pandemic levels.
It is important to note that energy transitions unfold gradually, often spanning several decades. A review of data as far back as the industrial revolution reveals that it typically takes anywhere from 30 to 90 years for a new technology to achieve market dominance or, in other words, from diffusion to dominance. The steam engine took a full 90 years to become the predominant source of power, and electricity took more than 65 years to surpass gas as the leading source of lighting. Energy transformation is a process, and it will take time to supplant established patterns and work habits.
Today, fossil fuels account for over 80% of primary energy consumption, whereas solar and wind make up just over 5%. The adoption of cost-efficient renewables, combined with government policies promoting a shift toward net-zero emissions, will alter this balance. Although the future of fossil fuels remains uncertain, predictions of a collapse in demand are too pessimistic.
Back in 1965, oil constituted 40% of the energy mix, but its dominance has waned, now representing less than a third of the total. Although its share has diminished, the overall energy consumption has more than tripled since then, with a compound annual growth rate of 2.4%. It is important to differentiate between the increasing number of barrels consumed and oil’s decline as a share of an expanding energy mix.
The global appetite for oil is on track to hit an all-time high by the end of this year. Stronger-than-expected global GDP growth and a structural improvement in jet fuel demand have driven this pace. The U.S., China and Europe combined account for half of global oil consumption. Demand in the rest of the world is still 1 million barrels a day below 2019 levels, suggesting that there is room for growth.
Major producers have so far offered a rather muted response. OPEC, which accounts for a third of global crude oil supply, is currently supplying around 2 million barrels fewer per day than it did in 2019. Russia, which has managed to maintain higher volumes post-Ukraine invasion, is still producing less than 2019 levels, but the growth outlook has dimmed due to sweeping sanctions imposed by the U.S. and its allies. The U.S., the world’s largest producer, is only now supplying more oil than before the pandemic. Given that U.S. horizontal rigs are still a quarter below pre-pandemic levels, we think the shale sector, which accounts for two-thirds of U.S. crude oil output, will continue to keep its “drill, baby drill” mindset in check.
Underinvestment in oil production remains a serious concern, especially since oil experiences a significant natural decline in output. For a conventional well, the decline rate, absent any capital expenditure, is estimated to be around 15%. For unconventional horizontal wells, like those scattered across U.S. shale basins, the decline rates are much higher. Even to maintain current levels, oil companies need to drill new wells to compensate for the natural decline of older wells. Global capital expenditure for exploration has halved from its 2014 peak to less than $400 billion in 2022 whereas demand grew more than 5% during the same period. Last year, the IEA estimated that the low level of oil investment could lead to global oil supplies falling below 95 million barrels per day by 2030, creating a potential shortfall if demand continues to grow.
When markets are undersupplied, the price of oil has historically oscillated between the marginal cost of new supply, which incentivizes the introduction of new supply, and the cost of demand destruction, which occurs when high oil prices negatively impact economic activity. When the markets are oversupplied, prices tend to trade between cash costs, the price at which supply becomes unprofitable, and the marginal cost of new supply, estimated to be around $80 a barrel. Demand destruction typically occurs when oil prices surpass 4% of GDP, which would be around $110 a barrel.
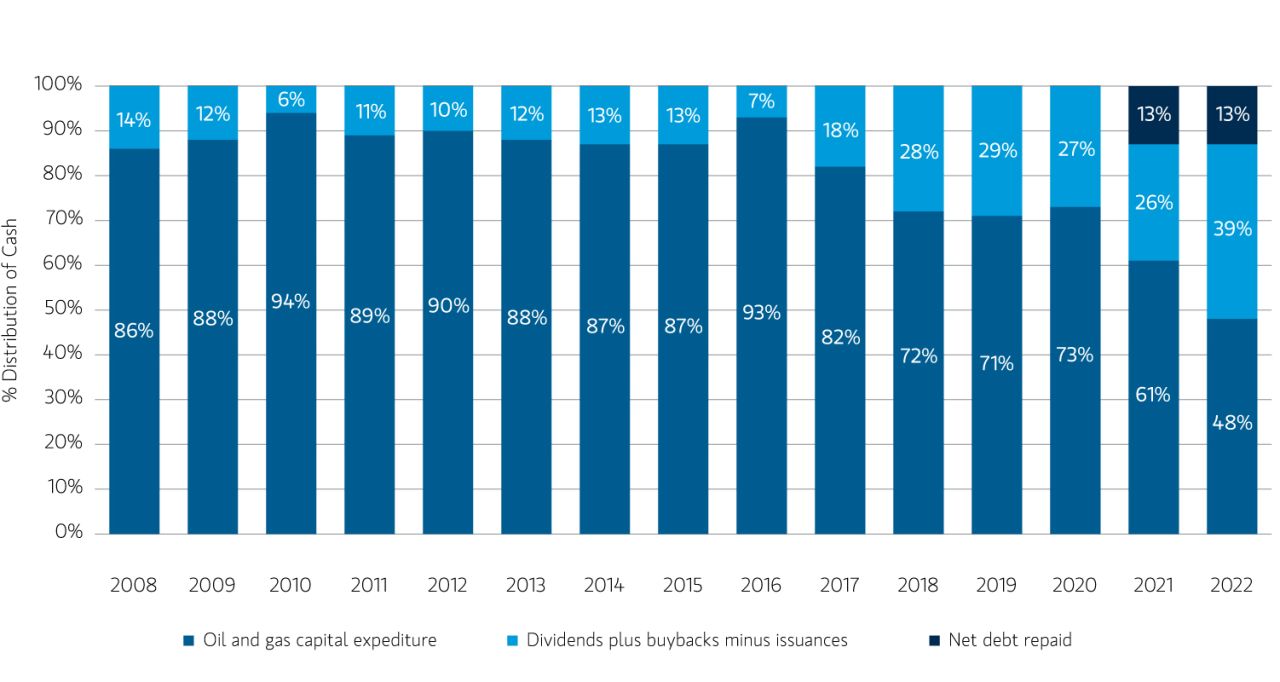
While global energy equities are attractively valued, their share in global equity market capitalization has declined from a peak of nearly 15% in 2008 to just 5% today (as of September 20, 2023). The industry has adopted a more investor-friendly approach to capital allocation, with last year marking the first time in over a decade that more cash was allocated to dividends, share buybacks and paying down debt than on capital expenditures. Energy equities’ normalized free-cash-flow yields, calculated using a trailing five-year average oil price of around $70 a barrel, are notably high compared to the broader market. This view indicates a significant level of investor skepticism toward energy equities, offering room for substantial potential gains, especially if companies maintain rigorous capital discipline in a high oil price environment.
Display 2 A Dollar in Hand is Better than Two in the Ground
Investors should continue to benefit from a more shareholder-friendly approach to capital allocation in the oil and gas industry

It is undeniable that energy transition is underway and renewable technologies will secure a larger share of the energy mix. Yet we believe a rapid decline in oil demand is not an immediate concern and will remain a distant prospect. The current levels of investment fall significantly short of what’s required to meet potential oil demand growth, leading to a supply shortfall. Consequently, we anticipate an oil price floor at around the marginal cost of $80 a barrel. This scenario leads to a compelling outlook for energy equities, which are set to benefit the most from renewed focus on shareholder value and attractive valuations during a period of “tighter for longer” oil market.


Diesen Beitrag teilen: