Janus Henderson: Three explanations for conflicting Chinese markets
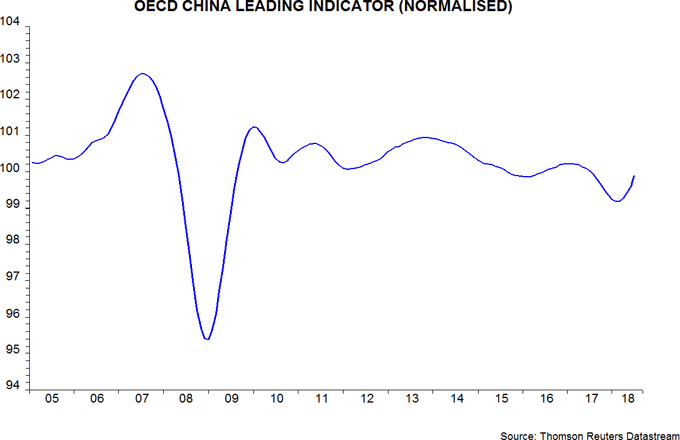
The OECD’s Chinese leading indicator has been giving a more positive message recently than narrow money trends. The indicator suggesting that economic growth will pick up during the second half of 2018.
30.08.2018 | 09:43 Uhr
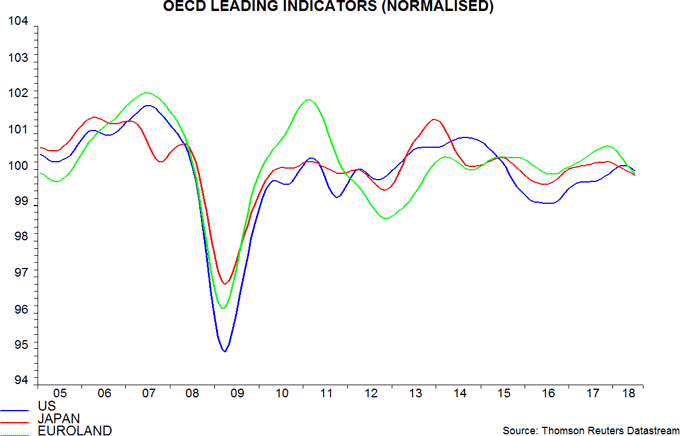
The OECD this week released June data for its composite leading indicators. As expected, the G7 measure fell further, with the US component as well as the Japanese / European indicators now signalling below-trend economic growth – see first chart*. Even the OECD concedes that its indicators “are pointing tentatively to easing growth momentum”, contradicting the claim in the organisation’s May Economic Outlook that “global GDP growth is set to strengthen further in 2018-19”.

The OECD’s leading indicators are used here as a cross-check of the message from monetary trends, although the lead time of the indicators is shorter - usually four to five months versus around nine months for money. The fall in the G7 indicator is consistent with an earlier slowdown in G7 real narrow money, growth of which remains weak. As previously discussed, however, the OECD’s Chinese leading indicator has been giving a more positive message recently than narrow money trends. This divergence widened further in June, with the indicator suggesting that economic growth will pick up during the second half of 2018 – second chart.

Three possible explanations for the conflicting Chinese monetary / leading indicator signals are:
1) Surging use of mobile payments is boosting monetary velocity, i.e. current low narrow money growth does not imply weak economic prospects.
2) The leading indicator has become unreliable because of rapid structural economic change.
3) The leading indicator, unusually, has turned ahead of narrow money, i.e. growth of the latter will strengthen over coming months, confirming an improving economic outlook.
Explanation 2) is currently favoured here, suggesting retaining a cautious view of economic prospects, while recognising that uncertainty is higher than normal.
On 1), the argument is that the rapid adoption of mobile payments technology has been associated with a fall in households’ desired holdings of currency and demand deposits, i.e. each unit of narrow money now supports a higher level of economic activity.
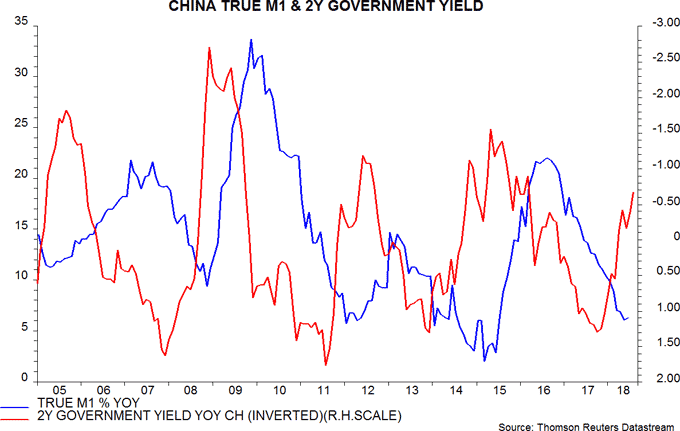
Such a velocity shift, however, would be expected to play out over several years and is unlikely to explain a collapse in annual narrow money** growth from 22% in August 2016 to 6% in June 2018.
The fall in money demand, moreover, would be expected to be focused on currency holdings of households. Currency, however, accounts for only 9% of narrow money and its annual growth has been relatively stable – the narrow money slowdown has been driven by demand deposits. Deposits of non-financial enterprises, meanwhile, have slowed by more than those of households.
Explanation 2) is based on the idea that the components of the OECD’s Chinese leading indicator were suitable for an earlier stage of the country’s development but do not capture the shift away from investment- and export-led growth towards consumer spending.
The six components of the indicator are: steel production, motor vehicle production, building completions, production of chemical fertilisers, the export orders balance from the PBoC’s quarterly 5000 enterprise survey and stock market turnover. The weighting of hard production data is higher than for other OECD country indicators, while there is no gauge of consumer behaviour.
To assess whether the recent upturn in the leading indicator reflects its unusual composition, an alternative indicator was constructed attempting to mirror the components of the OECD’s US leading indicator. A reasonable Chinese equivalent measure was judged to be available for six of the seven US components, the exception being average weekly hours worked in manufacturing – see table.

The third chart compares the performance of the official and alternative indicators. The alternative version appears better aligned with economic developments in recent years: it rose strongly from end-2015 ahead of a pick-up in growth in late 2016 / early 2017 and has been signalling trend or slightly below-trend expansion more recently.

The alternative leading indicator is giving a more positive message for economic prospects than narrow money trends but the divergence is much less pronounced than for the official indicator.
Explanation 3) for the conflicting monetary / leading indicator signals is that the usual timing relationship between the two has reversed. On this view, monetary trends should improve soon to confirm the stronger message from the leading indicator. As previously discussed, recent interest rate falls suggest a recovery in narrow money growth but the timing and magnitude are uncertain – fourth chart.

As noted, explanation 2) is currently favoured here, but 3) is preferred to 1). This assessment will be revised as necessary in light of incoming monetary and leading indicator data – starting with July money numbers scheduled to be released in the coming week.
*The indicators are expressed in trend-adjusted form, i.e. a rise signals above-trend economic growth.
**Narrow money = true M1 = currency plus demand deposits of households, non-financial enterprises and government organisations.


Diesen Beitrag teilen: