
BNP Paribas: Persistent outperformance of US markets
The US equity rally has been led by the IT sector. This has accounted for 20%-50% of US equity returns since 2016. The rally is now looking stretched on various metrics.
14.09.2018 | 14:18 Uhr
SUMMARY:
- US equities continued to outperform other markets such as EMU and EM equities. This partly reflects the divergence between the US economy -which is supported by fiscal expansion and a patient Federal Reserve- and relatively weaker growth in the eurozone and EM.
- But there is more to this divergence than faster US economic growth. The US equity rally has been led by the IT sector. This has accounted for 20%-50% of US equity returns since 2016. The rally is now looking stretched on various metrics.
- The other salient development in August was renewed stress in emerging markets (EM). A combination of economic stress in Turkey, weaker growth in China, Sino-US trade tensions and a stronger US dollar hurt EM assets.
- We believe there is value in EM assets, but the obvious circuit-breakers are still absent: a weaker USD, aggressive China stimulus and fresh Sino-US trade talks. EM assets prospects have soured and protectionism and tighter liquidity continue to cloud their longer-term prospects.
ASSET ALLOCATION:
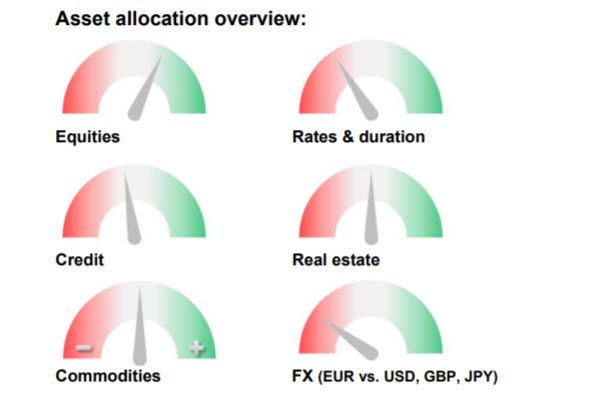
Our long-held view – being long equities and underweight fixed income, notably in the eurozone – remains in place, but we reduced our risk exposure in the past few weeks. In particular, we have made the following adjustments to our asset allocation:
- We increased our underweight in EMU government bonds, taking advantage of low German yields.
- We went short US IT stocks versus long US equities, and we took profits on our long US banks position.
- We closed our long EM equities versus US equities position, and reduced our long EM local debt exposure.
- We went long a 50/50 basket of JPY and USD versus EUR as a hedge against negative global shocks.
MARKET REVIEW: AUGUST 2018
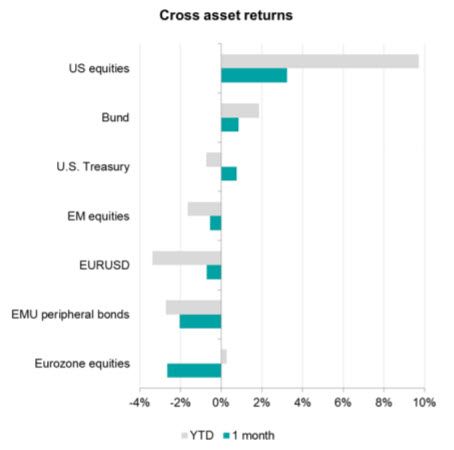
The main market moves in August have mirrored some of the key trends since the beginning of the year: the US equity market has continued to outperform major markets such as that of the eurozone and the emerging markets (Figure 1).
Figure 1: US equities continue to outperform EM and EMU equities
Source: Bloomberg
The good health of the US economy has been an important support for US equities. The unemployment rate is at historical lows and the Fed has remained patient in raising US interest rates and in signalling further increases. The S&P 500 equity index is back at an all-time high thanks to strong Q2 company earnings with earnings per share (EPS) growing by 25% YoY and 70% of companies beating analysts’ sales estimates. But as we discuss later on, the rally is short on breadth, with the IT sector having delivered most of the gains.
By contrast, eurozone growth has slowed from albeit healthy rates. Two other factors have weighed on EMU assets in recent months. First, Italian politics, notably the uncertainty over the size of the fiscal deficit in the forthcoming budget, have put pressure on ‘peripheral’ debt (Figure 1). In addition, a row with the US has re-exposed the weak fundamentals of the Turkish economy and has led to questions on European bank exposure. This has put further pressure on eurozone banks. Both factors have caused German Bund yields to fall to close to 0.30% and Bunds to outperform in price terms (Figure 1).
A further source of market stress has been the tension over trade between the US and various countries/regions, notably China. The US has made visible progress on trade with Mexico and the European Union, but talks with China have come to a standstill. The resulting uncertainty led to a rally in US Treasuries and a stronger USD vs. most major currencies and, notably, versus EM currencies.
EM assets struggled in this context, partly because growth in China has been slowing again. The authorities are easing policy in a targeted way, but to date, this has not been enough to reign in investor concerns over the downside risks to the economy. As a result, China-linked assets have significantly underperformed. In addition to Asian equities, copper lost 6.5% in August (down by almost 20% from its peak in June). The Australian dollar, which is also sensitive to market sentiment on China, fell by more than 3% in August versus the USD. Crude oil, however, rallied after the implementation of US sanctions on Iran. For now, these only cover financial transactions and some industries, but they are set to be extended to crude oil exports in November.
PERSISTENT OUTPERFORMANCE OF US MARKETS
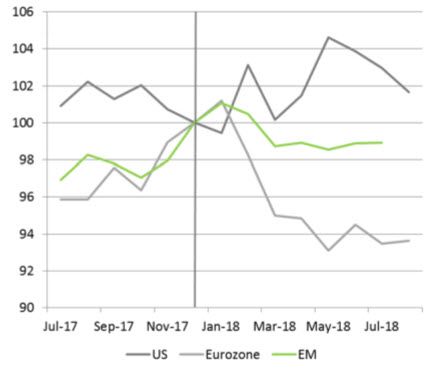
The divergence between the US equity market and, for example, EMU and EM markets reflects, to a large extent, relative economic performance. The US economy has remained strong, supported by fiscal expansion and a patient Fed. This contrasts with the eurozone and EM where growth, while still robust, has weakened (Figure 2).
Figure 2: Economic divergence between the US and the eurozone and EM
Source: Bloomberg
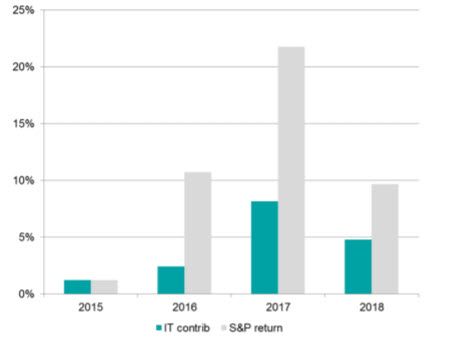
But there is more to this divergence than economic growth. The US equity market rally has been led by one prominent sector: information technology (IT). The US IT sector accounts for close to 25% of the S&P 500 index and close to 30% if we include Amazon which is usually regarded as part of the consumer discretionary sector. Not only is the US IT sector large, it so far has accounted for 20%-50% of US equity returns since 2016. Indeed, of the roughly 10% rally so far this year, the IT sector has accounted for some 5% (Figure 3).
Figure 3: US IT leads: contributions to US equity returns are high
Source: Bloomberg
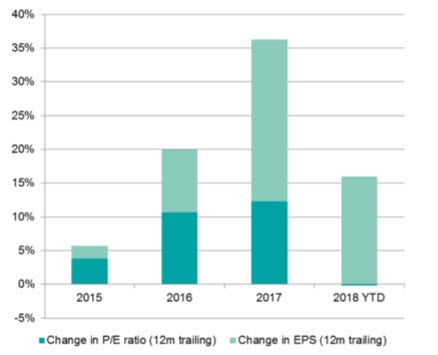
Many commentators worry that the rally has been driven mainly by an expansion of multiples, making the IT sector expensive in price/earnings (P/E) terms. In our view, quite the opposite is the case. Earnings in the sector have been strong since 2016. If anything, P/Es on a 12-month trailing basis have compressed so far this year, while earnings are up by 15% YoY (Figure 4). Relative to other sectors, IT is indeed one of the most expensive sectors with a 12-month trailing P/E of 24, but it is not materially higher than that of most other sectors or the index as a whole, which is at 22.
Figure 4: US IT sector performance has been driven by strong earnings, not just multiple expansion
Source: Bloomberg
The strong earnings tell us that the IT sector is benefiting from the cyclical upswing in the US. But the rally is now looking extended at a time when regulatory risks are rising, both domestically and abroad. We therefore would not be surprised if there is a correction relative to other sectors in the near term.
RENEWED STRESS IN EMERGING MARKETS
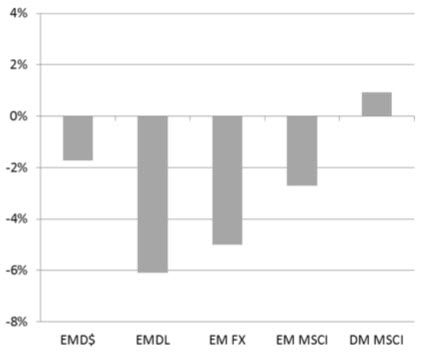
Another salient development over the past month or so has been renewed stress in emerging markets. In early August, a combination of economic stress in Turkey, weaker growth in China and a stronger USD caused EM assets to fall (Figure 5).
Figure 5: EM assets suffered again in August
Source: Bloomberg
EM assets were hit by four developments over the past few months. First, the Chinese economy has slowed by more than markets had expected and China’s policy response has not been overwhelming. Second, Sino-US trade tensions escalated and there was no progress in the latest round of discussions. Third, the USD appreciated across the board, boosted by Fed policy tightening and the US fiscal expansion. Fourth, an escalation of tensions between the US and Turkey along with weak external fundamentals put renewed pressure on Turkish assets. This spilled over into various emerging markets, especially those with external vulnerabilities such as Argentina, South Africa and India.
A lot of bad news has already been discounted in the prices of EM local currency debt, largely reflecting EM currency losses. However, it is difficult to time a bounce because the potential circuit-breakers are not in place yet. They include a weaker USD, aggressive policy stimulus in China and constructive trade discussions between the US and China. These factors may emerge in the next few months and EM assets could then recover. After all, the growth prospects remain solid in many emerging markets and valuations are now generally attractive. However, the longer-term prospects are less clear-cut as uncertainty lingers over the evolution of Sino-US relations. Furthermore, unless US growth slows, tighter monetary policy will likely reduce the global search for yield and hurt EM assets.



Diesen Beitrag teilen: