


Janus Henderson: Intech - Market stress signals persist
The Intech Equity Market Stress Monitor is a collection of five metrics Intech believe are reliable indicators of equity market stress, based on the company’s 30-year history of studying volatility.
04.05.2018 | 09:21 Uhr
 Intech’s latest report - download here - suggests that risk for a dislocation in equity markets remains elevated, with European equity markets exhibiting the strongest stress signals while emerging markets show less signs of strain. These stress indicators suggest a continued potential for downside risk.
Indicators suggest heightened downside risk remains
After a long absence, volatility came roaring back during the first quarter of 2018. While big market moves rattled most major indices, they did little to move key indicators back toward their historical norms. The metrics comprising the Intech Equity Market Stress Monitor are telling us that the risk for a potential market dislocation persists.
At the end of the first quarter of 2018, five of the world’s major market indices – the Standard & Poor’s 500, MSCI World, MSCI EAFE, MSCI Europe and MSCI Emerging Markets – continued to deviate from their historic norms for several key indicators of equity market risk, including correlation, dispersion and index efficiency.
In fact, markets are exhibiting the same signs of strain that we observed in late 2017, before markets turned turbulent. During the first quarter of 2018 the S&P 500 ended its longest streak without a 3% correction and its second-longest stretch without a 5% decline. Whereas 2017 saw just eight trading days with +/- 1% or larger moves, the first quarter of 2018 alone posted 23 such trading days.
As was the case late last year, the MSCI Europe Index is showing the greatest signs of stress with five out of five equity-risk metrics on the extreme ends relative to historical norms.
Expect a reversion to the mean
Intech has been studying the relationship between risk and market stability for decades. Rather than rely solely on backward-facing measures, such as standard deviation, investors can monitor market stability, or lack thereof, by noting where an index’s risk sits relative to its historical ranges. When markets teeter too far from the norm, there is a higher probability of a large market event.
For all five metrics reviewed here, the normal range is 40% to 60%. Anything higher or lower signals a potential market instability, with extremes in the tails (ie, less than 20% or more than 80%) indicating greater risk.
Capital concentration, which measures how capital is distributed among stocks in an index, saw the greatest reshuffling during the first quarter. Among US markets, concentration increased noticeably, reflecting the ongoing dominance of mega-cap technology stocks. It was a different story in other developed equity markets, where capital continued to flow into smaller-cap stocks.
In a typical market, concentration is neither too high, nor too low. In the first quarter, just one of the five major indices – the MSCI World – sat in the normal range.
Correlation of returns (figure 1) – the extent to which index constituents move together – remained on the extreme low end in the first quarter of 2018, suggesting that idiosyncratic risk is high. This environment tends to favour active managers. However, because another indicator, dispersion of returns, is also low, active managers need to take on more incremental risk to potentially achieve higher excess returns.
Figure 1: Correlation of returns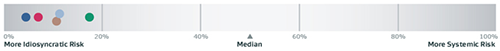
(Source: Intech proprietary model, as at 31 March 2018)
Meanwhile, index efficiency stayed perched on the high end for all major indexes, which is to say that managers need to take on more beta risk to achieve above-market returns. This proprietary indicator looks at how much beta (market exposure) is required to construct an efficient portfolio (outperforming the index with less risk) by owning a selection of index constituents.
Not surprisingly, investors were slightly less bullish in the first quarter than they were during the last three months of 2017. Skewness of returns (figure 2), which gauges how investors respond to positive or negative surprises, suggests above-normal bullishness for the MSCI Europe and, to a lesser degree, the S&P 500. Sentiment for the MSCI EAFE and MSCI Emerging Markets indices, meanwhile, have moved closer to normal ranges.
Figure 2: Skewness of returns
(Source: Intech proprietary model, as at 31 March 2018)
While there are many ways to gauge market risk, our research has shown that these five metrics are indicative of the current level of market stability. As we look out over the next year, markets still have the potential for incremental gains. Nevertheless, until these measures move closer to their long-term averages, the risk for higher volatility will persist.
Diesen Beitrag teilen: