


Robeco: Das passiert an den September-Märkten
In seinem aktuellen Blog-Beitrag, widmet sich Jeroen Blokland den Märkten im September. Wie werden sie sich verhalten?
31.08.2015 | 14:38 Uhr
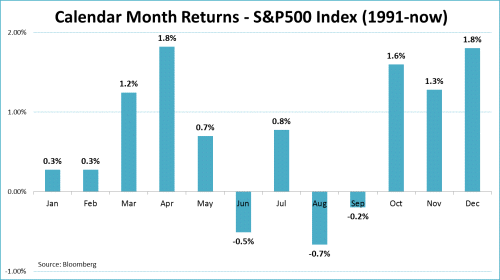
September is upon us! This means we are entering the calendar month that’s considered by many as the cruelest for equities. And this year, as a ‘bonus’, it follows an already ugly August.
So how do markets behave in September? The graph below shows the calendar month returns for the S&P 500 index since 1991. As the graph reveals, September is indeed an unpleasant month for equities. But it’s certainly not the cruelest. In fact, the worst month for U.S. equities, August, is just behind us. That said, the best part of the year (Oct – Dec) is also another month away. Disclaimer: this, and everything below, is all solely based on historical data, of course!
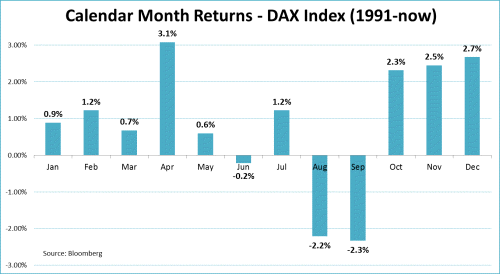
So, how are things for equity markets in other parts of the world? For example in Germany? As the graph below shows, September is worst month for the DAX Index. Based on historical data since 1991, August and September represent a pretty rough period for German stocks.
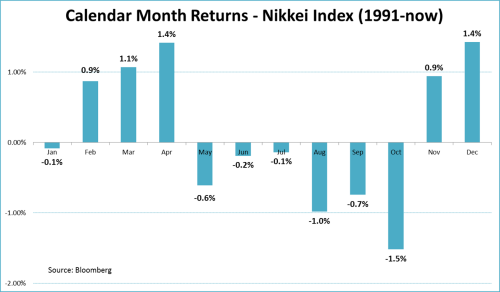
Next up: Japan. The graph below reveals September is also pretty tough on the Nikkei Index. Since 1991, Japanese equities lost almost 1% in September. Comparable to seasonality in Germany, Japanese equities are currently in the least favorable part of the year. A difference with Germany is that, historically, the ‘unfriendly’ season is one month longer in Japan, as October brings even more pressure on the Nikkei.
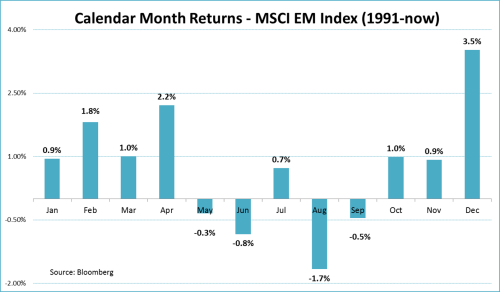
And what about emerging markets? The pattern in emerging market returns resembles that of the S&P 500 Index. September has historically yielded negative returns, but other months are worse. As for the S&P 500, it takes another month to reach the fun part of the year.
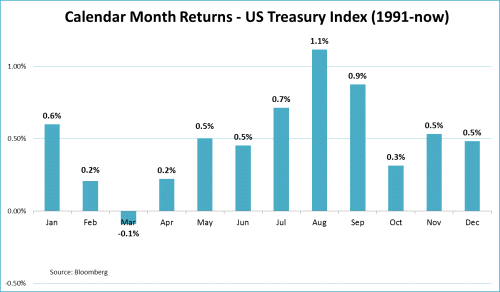
The graphs shown above confirm why equity investors are not particularly fond of September. For bond investors this is quite the opposite. July – September represent the best return period for U.S. Treasuries. The dispersion in returns is less explicit than for equities, but the difference in return with other calendar months, especially those at the beginning of the year, is profound.
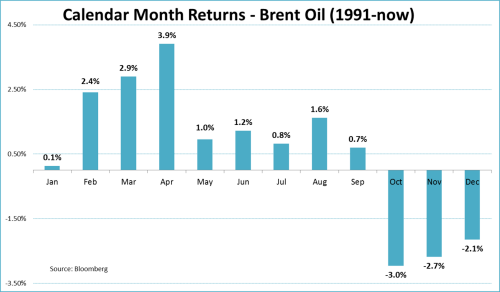
For oil investors, September is still ‘ok’, but after that things really start to look ugly. So, if history means anything, oil prices could remain under pressure for the remainder of the year.
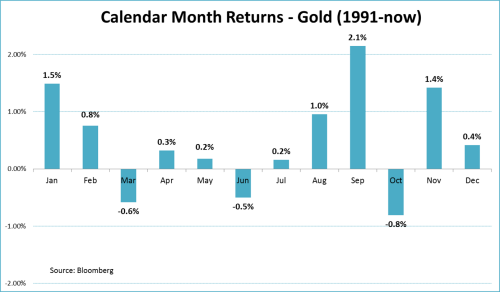
The seventh and last graph is dedicated to gold. The former love baby of investors has realized its best return in September. That matches gold’s status as a contrarian investment. When equities are struggling, gold prices pick up. Overall, though, the seasonal pattern for gold is clearly more murky than that of other classes.
To be continued…probably in October.
Diesen Beitrag teilen: